- Update: At 6:15 p.m. AST (10:15 p.m. UTC), Post-Tropical Dorian has made landfall near Sambro Creek in Nova Scotia, Canada, or about 15 miles (25 km) south of Halifax. The estimated maximum sustained winds at landfall were 100 mph (155 km/h) & the estimated central pressure was 958 mb (28.29 inches). Check out the latest Advisory at nhc.noaa.gov
- Update: NHC's cones and tracks for Dorian (Adv. 59) and Gabrielle (Adv. 18) have been uploaded to Windy..
- Update: Dorian becomes a Hurricane-Force Post-Tropical Cyclone. Center is now near the southern coast of Nova Scotia. At 5:00 p.m. AST (9.00 p.m. UTC), the center of Dorian was near 43.9N, 63.9W, moving toward the northeast near 30 mph (48 km/h), and this general motion is expected to continue for the next 24 hours. After that, a turn toward the east-northeast is expected. On the forecast track, the center of Dorian should cross the coast of Nova Scotia near Halifax during the next few hours, then move across eastern Nova Scotia into the Gulf of St. Lawrence near Prince Edward Island tonight. The center should then pass near or over northern Newfoundland and eastern Labrador late tonight or Sunday morning. Maximum sustained winds are near 100 mph (155 km/h) with higher gusts. The post-tropical cyclone is expected to weaken during the next couple of days, and it is forecast to drop below hurricane strength by Sunday morning. Hurricane-force winds extend outward up to 115 miles (185 km) to the south of the center and tropical-storm-force winds extend outward up to 310 miles (500 km). Osbourne Head, Nova Scotia, recently reported sustained winds of 68 mph (109 km/h) and a wind gust of 88 mph (142 km/h). The estimated minimum central pressure is 953 mb (28.15 inches). (Advisory 59, nhc.noaa.gov)
- Update: We've uploaded the Hurricane Dorian cone/track (Adv. 58) to Windy, including Tropical Storm Gabrielle (Adv. 17).
- Update: At 2:00 p.m. AST (6:00 p.m. UTC), the center of Hurricane Dorian was located near 42.8N, 64.9 W. Dorian is moving toward the northeast near 29 mph (46 km/h), and a general motion toward the northeast is expected to continue through Sunday night. Recent satellite wind data indicate that the maximum sustained winds are now near 100 mph (155 km/h) with higher gusts. While Dorian is forecast to weaken and become a post-tropical cyclone during the next 24 hours, it is expected to maintain hurricane-force winds as it moves across eastern Canada this afternoon through Sunday. Hurricane-force winds extend outward up to 115 miles (185 km) to the south of the center, and tropical-storm-force winds extend outward up to 310 miles (500 km). NOAA buoy 44011 to the southwest of the center recently reported sustained winds of 74 mph (119 km/h) and a [wind gust](link url) of 94 mph (151 km/h). A station at Baccarro Point, Nova Scotia, recently reported sustained winds of 58 mph (93 km/h). The estimated minimum central pressure is 953 mb (28.15 inches). (Adv. 58, nhc.noaa.gov)
- Update: We've uploaded the Hurricane Dorian Advisory 55 cone/track to Windy, including Tropical Storm Gabrielle (Adv. 14).
- Update: The Canadian Hurricane Center has adjusted the warnings for Nova Scotia and New Brunswick and a hurricane warning is now in effect from Lower East Pubnico eastward around Nova Scotia to Avonport, and the tropical storm warning is effect from Tidnish to Brule and from Fundy National Park to Shediac. At 11:00 p.m. EDT (3:00 a.m. UTC), the center of Hurricane Dorian was located near 38.3N, 70.2W, moving toward the northeast near 25 mph (41 km/h). Max. sustained winds remain near 90 mph (150 km/h), the estimated minimum central pressure is 960 mb (28.35 inches). (Advisory 55, nhc.noaa.gov)
- Update: We've uploaded the latest cone/track forecast from NHC's Intermediate Advisory #54A to Windy. Click here to view it on any Windy forecast (or satellite/radar) layer. The text of the latest public advisory is available at nhc.noaa.gov
- Update: At 5:00 p.m. EDT (9:00 p.m. UTC), Category 1 Hurricane Dorian was near 36.9N, 72.7W, moving toward the northeast near 24 mph (39 km/h). Maximum sustained winds are near 90 mph (150 km/h). Dorian should move move to the southeast of extreme southeastern New England tonight and Saturday morning, and then across Nova Scotia late Saturday or Saturday night. Some strengthening is possible during the next 24 hours. Dorian is forecast to become a post-tropical cyclone with hurricane-force winds Saturday night or Sunday while it is near or over eastern Canada.
 Tropical storm conditions will persist for a few more hours in the warning area over the Mid-Atlantic states. Tropical storm conditions are expected in the warning area over portions of extreme southeastern Massachusetts tonight or early Saturday, and in the warning area in Maine Saturday afternoon. Regardless of whether Dorian is a hurricane or a post-tropical cyclone, hurricane conditions are expected in the Hurricane Warning area Saturday or Saturday night, and they are possible in the Hurricane Watch area Saturday or Saturday night. Tropical storm conditions are expected in the Tropical Storm Warning area in Canada by Saturday, and they are possible in the Tropical Storm Watch area Saturday and Saturday night. The Canadian Hurricane Center has issued a Tropical Storm Watch for Newfoundland from Boat Harbour to Triton. All Hurricane and Tropical Storm Warnings are discontinued south of the North Carolina/Virginia Border. The Tropical Storm Warning is discontinued for the Tidal Potomac south of Cobb Island. The Storm Surge Warning has been discontinued north of the North Carolina/Virginia border. (Advisory 54, nhc.noaa.gov)
 - Update: We've uploade the latest cone & track forecasts for Hurricane Dorian (Adv. 53) and Tropical Storm Gabrielle (Adv. 12)
- Update: At 11:00 a.m. EDT (3:00 p.m. UTC), the center of Hurricane Dorian was near 35.7N, 74.8W. Hurricane conditions should end along portions of the North Carolina coast during the next few hours. Tropical storm conditions should continue on the southeastern coast of Virginia for the next several hours, and are expected to spread across other portions of the the Mid-Atlantic states later today. Tropical storm conditions are also expected in the warning area over portions of extreme southeastern Massachusetts tonight or early Saturday, and in the warning area in Maine Saturday afternoon (Advisory 53, nhc.noaa.gov)
- Update: We've uploaded the latest NHC's cone and track forecast for Hurricane Dorian (Adv. 51)
- Update: We've uploaded the latest NHC's cone and track forecast for Hurricane Dorian (Adv. 50) and TS Gabrielle (Adv. 9)
- Update: At 5:00 p.m. EDT (9:00 p.m. UTC), the eye of [Hurricane Dorian](link url) was near 33.1N, 78.5W, max. sustained winds are now near 105 mph (165 km/h). The Tropical Storm Watch from Woods Hole to Sagamore Beach, Massachusetts, and for Martha's Vineyard and Nantucket has been changed to a Tropical Storm Warning. The Hurricane Warning from Savannah River to south of Edisto Beach, South Carolina has been changed to a Tropical Storm Warning. The Storm Surge Warning has been discontinued south of Little River Inlet.
 Summary of warnings in effect: A Storm Surge Warning is in effect for Little River Inlet to Poquoson VA, Pamlico and Albemarle Sounds, Neuse and Pamlico Rivers, and Hampton Roads. A Hurricane Warning is in effect for Edisto Beach SC to the North Carolina/Virginia border, and Pamlico and Albemarle Sounds. A Tropical Storm Warning is in effect for Savannah River to south of Edisto Beach SC, North Carolina/Virginia border to Fenwick Island DE, Chesapeake Bay from Drum Point southward, Tidal Potomac south of Cobb Island, Woods Hole to Sagamore Beach MA, and Nantucket and Martha's Vineyard MA (Advisory 50, nhc.noaa.gov)
 - Update: We've uploaded the latest NHC's cones and track forecasts to Windy (Adv. 49)
- Update: At 11:00 a.m. EDT (3:00 p.m. UTC), the center of Hurricane Dorian was near 32.5N, 79.1W. Reports from Air Force Reserve and NOAA Hurricane Hunter aircraft indicate that
The Tropical Storm Warning has been extended northward to Fenwick Island, Delaware, and also extended northward in the Chesapeake Bay to Drum Point, including the Tidal Potomac River south of Cobb Island. The Storm Surge Warning has been discontinued south of Edisto Beach, South Carolina. (Advisory 49, nhc.noaa.gov)
- Update: We've uploaded the latest cone and track forecast for Hurricane Dorian (Adv. 48A) and Tropical Storm Gabrielle (Adv. 7).
- Update: Update At 8:00 a.m. EDT (12:00 p.m. UTC), the eye of Hurricane Dorian, strengthened to category 3 hurricane, was near 32.1N, 79.3W, with max. sustained winds near 115 mph (185 km/h). Dorian is now moving toward the north-northeast near 8 mph (13 km/h). A turn toward the northeast is anticipated by tonight, and a northeastward motion at a faster forward speed is forecast on Friday. On the forecast track, the center of Dorian will continue to move close to the coast of South Carolina today, and then move near or over the coast of North Carolina tonight and Friday. The center should move to the southeast of extreme southeastern New England Friday night and Saturday morning, and approach Nova Scotia later on Saturday. (Advisory 48A, nhc.noaa.gov)
- Update: Tropical storm conditions occuring along portions of the South Carolina coast. A Weatherflow station at Winyah Bay, South Carolina recently reported sustained winds of 45 mph (72 km/h) and a wind gust of 58 mph (93 km/h). (Hurricane Dorian Tropical Cyclone Update 7:00 a.m. EDT / 11:00 a.m. UTC, NHC Miami Florida)
- Update: At 8:00 p.m. EDT (12:00 a.m. UTC), the large eye of Hurricane Dorian was located near 30.9N, 79.8W, max. sustained winds remain near 110 mph (175 km/h) with higher gusts. The minimum central pressure reported by the Hurricane Hunter is 959 mb (28.31 inches). (Advisory 46A, nhc.noaa.gov)
- Update: We've uploaded cone and track forecast for Hurricane Dorian (Adv #46), Tropical Storm Gabrielle (Adv. #7), Tropical Depression Fernand (Adv. #7), Hurricane Juliette (Adv. #17), Post-Tropical Cyclone Gil (Adv. #7)
- Update: At 8:00 a.m. EDT (12:00 p.m. UTC), the eye of Hurricane Dorian, strengthened to category 3 hurricane, was near 32.1N, 79.3W, with max. sustained winds near 115 mph (185 km/h). Dorian is now moving toward the north-northeast near 8 mph (13 km/h). A turn toward the northeast is anticipated by tonight, and a northeastward motion at a faster forward speed is forecast on Friday. On the forecast track, the center of Dorian will continue to move close to the coast of South Carolina today, and then move near or over the coast of North Carolina tonight and Friday. The center should move to the southeast of extreme southeastern New England Friday night and Saturday morning, and approach Nova Scotia later on Saturday. (Advisory 48A, nhc.noaa.gov)
- Update: Tropical storm conditions occuring along portions of the South Carolina coast. A Weatherflow station at Winyah Bay, South Carolina recently reported sustained winds of 45 mph (72 km/h) and a wind gust of 58 mph (93 km/h). (Hurricane Dorian Tropical Cyclone Update 7:00 a.m. EDT (11:00 a.m. UTC), NHC Miami Florida)
- Update: At 8:00 p.m. EDT (12:00 a.m. UTC), the large eye of Hurricane Dorian was located near 30.9N, 79.8W, max. sustained winds remain near 110 mph (175 km/h) with higher gusts. The minimum central pressure reported by the Hurricane Hunter is 959 mb (28.31 inches). (Advisory 46A, nhc.noaa.gov)
- Update: We've uploaded cone and track forecast for Hurricane Dorian (Adv #46), Tropical Storm Gabrielle (Adv. #5), Tropical Depression Fernand (Adv. #7)
- Update: At 5:00 p.m. EDT (9:00 p.m. UTC), the center of Hurricane Dorian was located near 30.6N, 79.8W, with max. sustained winds increased to near 110 mph (175 km/h), moving toward the north-northwest near 8 mph (13 km/h). A turn to the north is expected tonight, followed by a turn to the north-northeast on Thursday and a turn toward the northeast on Thursday night. A northeastward motion at a faster forward speed is forecast on Friday. On the forecast track, the center of Dorian will approach the coast of South Carolina tonight, move near or over the coast of South Carolina on Thursday, and move near or over the coast of North Carolina Thursday night and Friday.
 The Storm Surge Warning has been extended northward to Poquoson, Virginia, including Hampton Roads. A Tropical Storm Warning has been issued from the North Carolina/Virginia border to Chincoteague, Virginia, and for the Chesapeake Bay from Smith Point southward. A Tropical Storm Watch has been issued from north of Chincoteague, Virginia, to Fenwick Island, Delaware, for the Chesapeake Bay from Smith Point to Drum Point, and for the Tidal Potomac River south of Cobb Island. The Storm Surge Warning and Tropical Storm Warning have been discontinued south of the Flagler/Volusia County line. (Advisory 46, nhc.noaa.gov)
 - Update: We've uploaded (NHC's Adv. #44 cone and track forecast, now Including Tropical Storm Fernand and Tropical Storm Gabrielle
- Update At 5:00 a.m. EDT (9:00 a.m. UTC), the center of Hurricane Dorian was located near 29.2N, 79.5 W. Maximum sustained winds are near 105 mph (165 km/h). The minimum central pressure reported by an Air Force Reserve Unit Hurricane Hunter aircraft is 963 mb (28.44 inches). The government of the Bahamas has discontinued all Tropical Storm Warnings for the Bahamas. The Tropical Storm Warning south of Sebastian Inlet, FL has been discontinued. The Hurricane Warning from Sebastian Inlet FL to the Volusia/Brevard County FL line is changed to a Tropical Storm Warning.
- Update We've uploaded (NHC's Adv. #42 cone and track forecast
- Update At 5:00 p.m. EDT (9:00 p.m. UTC), the center of Hurricane Dorian was located near 27.7N, 78.7W, with
- Update At 11:00 a.m. EDT (3:00 p.m. UTC). Dorian, weakened to category 3 hurricane, was near 27.1N, 78.6W, max. sustained winds near 110 mph (175 km/h), min. central pressure 955 mb (28.20 inches). Check out the latest cone and track forecast.
The Storm Surge Warning has been extended northward to South Santee River, South Carolina. The Storm Surge Watch has been extended northward to Cape Lookout, North Carolina. A Hurricane Warning has been issued for the coast of South Carolina from north of Edisto Beach to the South Santee River. A Hurricane Watch has been issued from north of South Santee River to Duck, North Carolina, including the Pamlico and Albemarle Sounds. The Tropical Storm Warning has been extended north to Edisto Beach, South Carolina. The Storm Surge Warning has been discontinued south of Jupiter Inlet, Florida. The Storm Surge Watch has been discontinued south of Lantana, Florida has been discontinued. The Hurricane Watch from Deerfield Beach to Jupiter Inlet has been discontinued. The Tropical Storm Watch from Golden Beach to Deerfield Beach has been discontinued. (Adv. 41 by NWS National Hurricane Center Miami FL - nhc.noaa.gov) - Update At 11:00 p.m. EDT (3:00 a.m. UTC), the eye of Hurricane Dorian was located near 26.9N, 78.5W. Maximum sustained winds are near 130 mph (215 km/h) with higher gusts. The estimated minimum central pressure based on data from the Air Force and NOAA Hurricane Hunters was 946 mb (27.94 inches). View the latest cone and track on any Windy layer.
- Update At 8:00 p.m. EDT (12:00 a.m. UTC), the eye of Hurricane Dorian was near 26.8N, 78.4W. Category 4 Hurricane Dorian remains nearly stationary just north of Grand Bahama Island - Intermediate Advisory Number 38A (nhc.noaa.gov)
 Click to check out the Advisory Number 38A cone & track on any Windy layer
 - Update We've uploaded the NHC's cone & track from Advisory #38 to Windy.
- Update The eye of dangerous hi-end category 4 Hurricane Dorian around 10 p.m. UTC

- Update Devastating conditions caused by Category 4 Hurricane Dorian continue on Grand Bahama Island. At 5:00 p.m. EDT (9:00 p.m. UTC), the eye of Hurricane Dorian was located near 26.8N, 78.4W. Dorian has become nearly stationary this afternoon. A slow westward to west-northwestward motion is expected to resume overnight and continue into early Tuesday. A turn toward the northwest is forecast by late Tuesday, with a northeastward motion forecast to begin by Wednesday night. On this track, the core of extremely dangerous Hurricane Dorian will continue to pound Grand Bahama Island into Tuesday morning.
Dorian will then move dangerously close to the Florida east coast late Tuesday through Wednesday evening and then move dangerously close to the Georgia and South Carolina coasts on Wednesday night and Thursday.
An Air Force Reserve Hurricane Hunter aircraft has found that max. sustained winds are near 145 mph (230 km/h) with higher gusts.
Sustained winds of 55 mph (89 km/h) with a gust to 69 mph (111 km/h) was recently reported at a NOAA Coastal Marine observing site at Settlement Point on the west end of Grand Bahama Island. A wind gust of 43 mph (69 km/h) was reported at Opa Locka Airport near Miami earlier this afternoon. The latest minimum central pressure reported by an Air Force Reserve Hurricane Hunter aircraft is 940 mb (27.76 inches).
A Storm Surge Warning is in effect for Lantana to Altamaha Sound. A Storm Surge Watch is in effect for North of Deerfield Beach to south of Lantana and Altamaha Sound to South Santee River. A Hurricane Warning is in effect for Grand Bahama and the Abacos Islands in the northwestern Bahamas and Jupiter Inlet to Ponte Vedra Beach. A Hurricane Watch is in effect for North of Deerfield Beach to Jupiter Inlet and North of Ponte Vedra Beach to South Santee River. A Tropical Storm Warning is in effect for North of Deerfield Beach to Jupiter Inlet. A Tropical Storm Watch is in effect for North of Golden Beach to Deerfield Beach and Lake Okeechobee (Adv. 38 by NWS National Hurricane Center Miami FL - nhc.noaa.gov) - Update At 11:30 a.m. UTC, Hurricane Dorian was approx. at 26.48N, 78.17W. With max. sustained winds of 155 mph, Dorian weakened to hi-end Category 4 Hurricane.
- Update Category 5 Dorian continues to have devastating impacts on Grand Bahama Island. Uploaded the latest cone & track forecast from the NHC's Advisory 36. Check it out on any Windy forecast layer. Current Summary: Location: 26.6N 78.2W (about 40 miles (60 km) E of Freeport Grand Bahama island, 115 miles (190 km) E of West Palm Beach Florida), max sustained winds: 165 mph (270 km/h), min. central pressure: 916 Mb (27.05 inches)
- Update Uploaded the latest cone & track forecast from the NHC's Advisory 35. Check it out on any Windy forecast layer.
- Update Catastrophic Category 5 Dorian makes landfall on the eastern end of Grand Bahama island. Maximum sustained winds are near 180 mph (285 km/h). A Storm Surge Warning is in effect for Lantana to the Volusia/Brevard County Line. A Storm Surge Watch is in effect for North of Deerfield Beach to Lantana and Volusia/Brevard County Line to the Mouth of the St. Mary's River. A Hurricane Warning is in effect for Northwestern Bahamas excluding Andros Island and Jupiter Inlet to the Volusia/Brevard County Line. A Hurricane Watch is in effect for Andros Island, North of Deerfield Beach to Jupiter Inlet and Volusia/Brevard County Line to the Mouth of the St. Mary's River. A Tropical Storm Warning is in effect for North of Deerfield Beach to Jupiter Inlet. A Tropical Storm Watch is in effect for North of Golden Beach to Deerfield Beach and Lake Okeechobee (Advisory #35, 11:00 p.m. EDT/ 3:00 a.m. UTC by nhc.noaa.gov)
- Update Catastrophic Category 5 Hurricane Dorian is pounding Great Abaco and Grand Bamaha. Hurricane conditions are expected in Florida by late Monday/Tuesday. At 8:00 p.m. EDT (0:00 UTC), the distinct eye of Hurricane Dorian was located near 26.6N, 77.6W, moving toward the west near 5 mph (7 km/h). Maximum sustained winds remain near 185 mph (295 km/h) - NHC's Advisory 34A
- Update Added the latest NHC's cone & track (Adv. #34).
- Update The distinct eye of powerful Hurricane Dorian is moving over Great Abaco. The latest wind and pressure data from an Air Force reconnaissance plane just before the eye hit the island indicated that the winds reached exceptional 160 kt. The minimum pressure measured by the plane was 910 mb. The eye has been shrinking, and an eyewall replacement cycle is possibly occurring. The effect of the island terrain and the eyewall replacement cycle should result in some slight fluctuations in intensity during the next 24 to 36 hours, but the hurricane will continue to be extremely dangerous one during that time. After 3 days, a more definite weakening trend should begin. Dorian however, it is forecast to remain a hurricane for the next 5 days. Dorian is expected to slow down a little more, prolonging its catastrophic effects in the northwestern Bahamas. The NHC forecast calls for a slow west to west-northwest motion during the next 48 hours. Both the deterministic and consensus tracks have shown the usual variability to the right or to the left from run to run, but the overall trend is for the hurricane to turn northward offshore but dangerously close to the Florida peninsula. Given the uncertainty in the track forecast and the anticipated increase in size of the hurricane, a Hurricane Warning and Storm Surge Warning have been issued for a portion of the Florida east coast. It is once again emphasized that although the official track forecast does not show landfall, users should not focus on the exact track. A small deviation to the left of the track could bring the intense core of the hurricane its dangerous winds closer to or onto the Florida coast.
 (Advisory #34 by NWS National Hurricane Center Miami FL)
 - Update The extremely distinct eye of catastrophic Hurricane Dorian is now over Abacos Islands in The Bahamas heading with all its fury toward Grand Bamaha. At 2:00 p.m. EDT (6:00 p.m. UTC), the eye of Hurricane Dorian was located near 26.5N, 77.1W. Maximum sustained winds are near 185 mph (295 km/h) with higher gusts.(Hurricane Dorian Intermediate Advisory 33A)
- Update Uploaded the latest cone & track forecast from the NHC's Advisory 33. Check it out on any Windy weather/climate layer.
- Update At 11:00 a.m. EDT (3:00 p.m. UTC) Dorian was located near 26.5N, 76.8W, about 205 miles (330 km) E of W Palm Beach, Florida, max. sustained winds 180 mph (285 km/h). A Storm Surge Watch is in effect for North of Deerfield Beach to the Volusia/Brevard County Line. A Hurricane Warning is in effect for Northwestern Bahamas excluding Andros Island. A Hurricane Watch is in effect for Andros Island and North of Deerfield Beach to the Volusia/Brevard County Line. A Tropical Storm Warning is in effect for North of Deerfield Beach to Sebastian Inlet. A Tropical Storm Watch is in effect for North of Golden Beach to Deerfield Beach and Lake Okeechobee.
- Update Dorian Tropical Cyclone Update 9:30 a.m. EDT (1:30 p.m. UTC) - Cat 5 Hurricane Dorian now has maximum sustained winds near 175 mph (280 km/h), with a minimum central pressure of 922 mb (27.23 inches). The eyewall of catastrophic Hurricane Dorian is currently reaching the Abaco Islands. This is a life-threatening situation. Residents there should take immediate shelter. Do not venture into the eye if it passes over your location. Hazards: Wind Gusts over 200 mph; Storm Surge 15 to 20 feet above normal tide levels with higher destructive waves. These hazards will cause extreme destruction in the affected areas and will continue for several hours.
- Update We've uploaded the NHC's Hurricane-Force Wind Probablilities forecast KMZ file to Windy. Also check out the Adv. 32A cone & track. (see the NHC's original graphics below)
- Update Dorian is now a category 5 hurricane. Data from an Air Force Hurricane Hunter plane indicate that the maximum sustained winds have increased to near 160 mph (260 km/h) with higher gusts. At 8:00 a.m. EDT (12:00 p.m. UTC), the distinct eye of Hurricane Dorian was located near 26.5N, 76.5W, moving toward the west near 8 mph (13 km/h). On its track, the core of extremely dangerous Hurricane Dorian should be moving over Great Abaco soon, and continue near or over Grand Bahama Island later tonight and Monday. The hurricane should move closer to the Florida east coast late Monday through Tuesday night.
 Check out the NHC's latest cone & track forecast (Adv. 32A) over any Windy layer.
  Check out the NHC's Dorian Hurricane-Force Wind Speed Probabilities forecast (Adv. 32A)** over any Windy layer
 - Update 31 August 2019 - Severe hurricane Dorian, maintaining its hi-end category 4 hurricane status, is forecast to hit portions of the northwestern Bahamas hard on Sunday. A Hurricane Warning is in effect for Northwestern Bahamas excluding Andros Island. A Hurricane Watch is in effect for Andros Island. A Tropical Storm Watch is in effect for Deerfield Beach to Sebastian Inlet. At 5:00 p.m. EDT (9:00 p.m. UTC), Dorian was near 26.2N, 74.4W, moving toward the west near 8 mph (13 km/h). A slower westward motion should continue for the next day or two, followed by a gradual turn toward the northwest. Maximum sustained winds remain near 150 mph (240 km/h) with higher gusts. Hurricane-force winds extend outward up to 30 miles (45 km) from the center and tropical-storm-force winds extend outward up to 105 miles (165 km). The estimated minimum central pressure is 945 mb (27.91 inches).
 (click to view the Adv. #30 cone on any Windy layer)
 - Update At 2:00 p.m. EDT (6:00 p.m. UTC), the distinct eye of Hurricane Dorian was located near latitude 26.1 North, longitude 73.9 West. Dorian is moving toward the west near 8 mph (13 km/h), and a slower westward motion should continue into early next week. On this track, the core of Dorian should move over the Atlantic well north of the southeastern and central Bahamas today, be near or over the northwestern Bahamas on Sunday, and move near the Florida east coast late Monday through Tuesday. Maximum sustained winds are near 150 mph (240 km/h)
- Update Check out the Hurricane Dorian Advisory #29 cone and track by the NHC over any Windy layer here.
- Update At 3:00 p.m. UTC, Category 4 hurricane Dorian was located near 26.0N, 73.24W. Data from both NOAA and Air Force Hurricane Hunter planes indicate that the maximum sustained winds have increased to near 150 mph (240 km/h) with higher gusts. Some fluctuations in intensity are likely, but Dorian is expected to remain a powerful hurricane during the next few days. A Hurricane Warning is in effect for Northwestern Bahamas excluding Andros Island. A Hurricane Watch is in effect for Andros Island.
- Update Dorian strengthened to major category 4 hurricane, with max. sustained winds near 140 mph (220 km/h). Some strengthening is possible today. Although fluctuations in intensity are possible early next week, Dorian is expected to remain a powerful hurricane during the next few days. At 2:00 a.m. EDT (6:00 a.m. UTC), the center of Hurricane Dorian was located near 25.6N, 72.0W. On its track, the core of Dorian should move over the Atlantic well north of the southeastern and central Bahamas today, be near or over the northwestern Bahamas on Sunday, and be near the Florida east coast late Monday. (Hurricane Dorian Intermediate Advisory Number 27A)
- Update Check out the NHC's Earliest-Reasonable Time of Arrival (Adv. #26) on any Windy layer

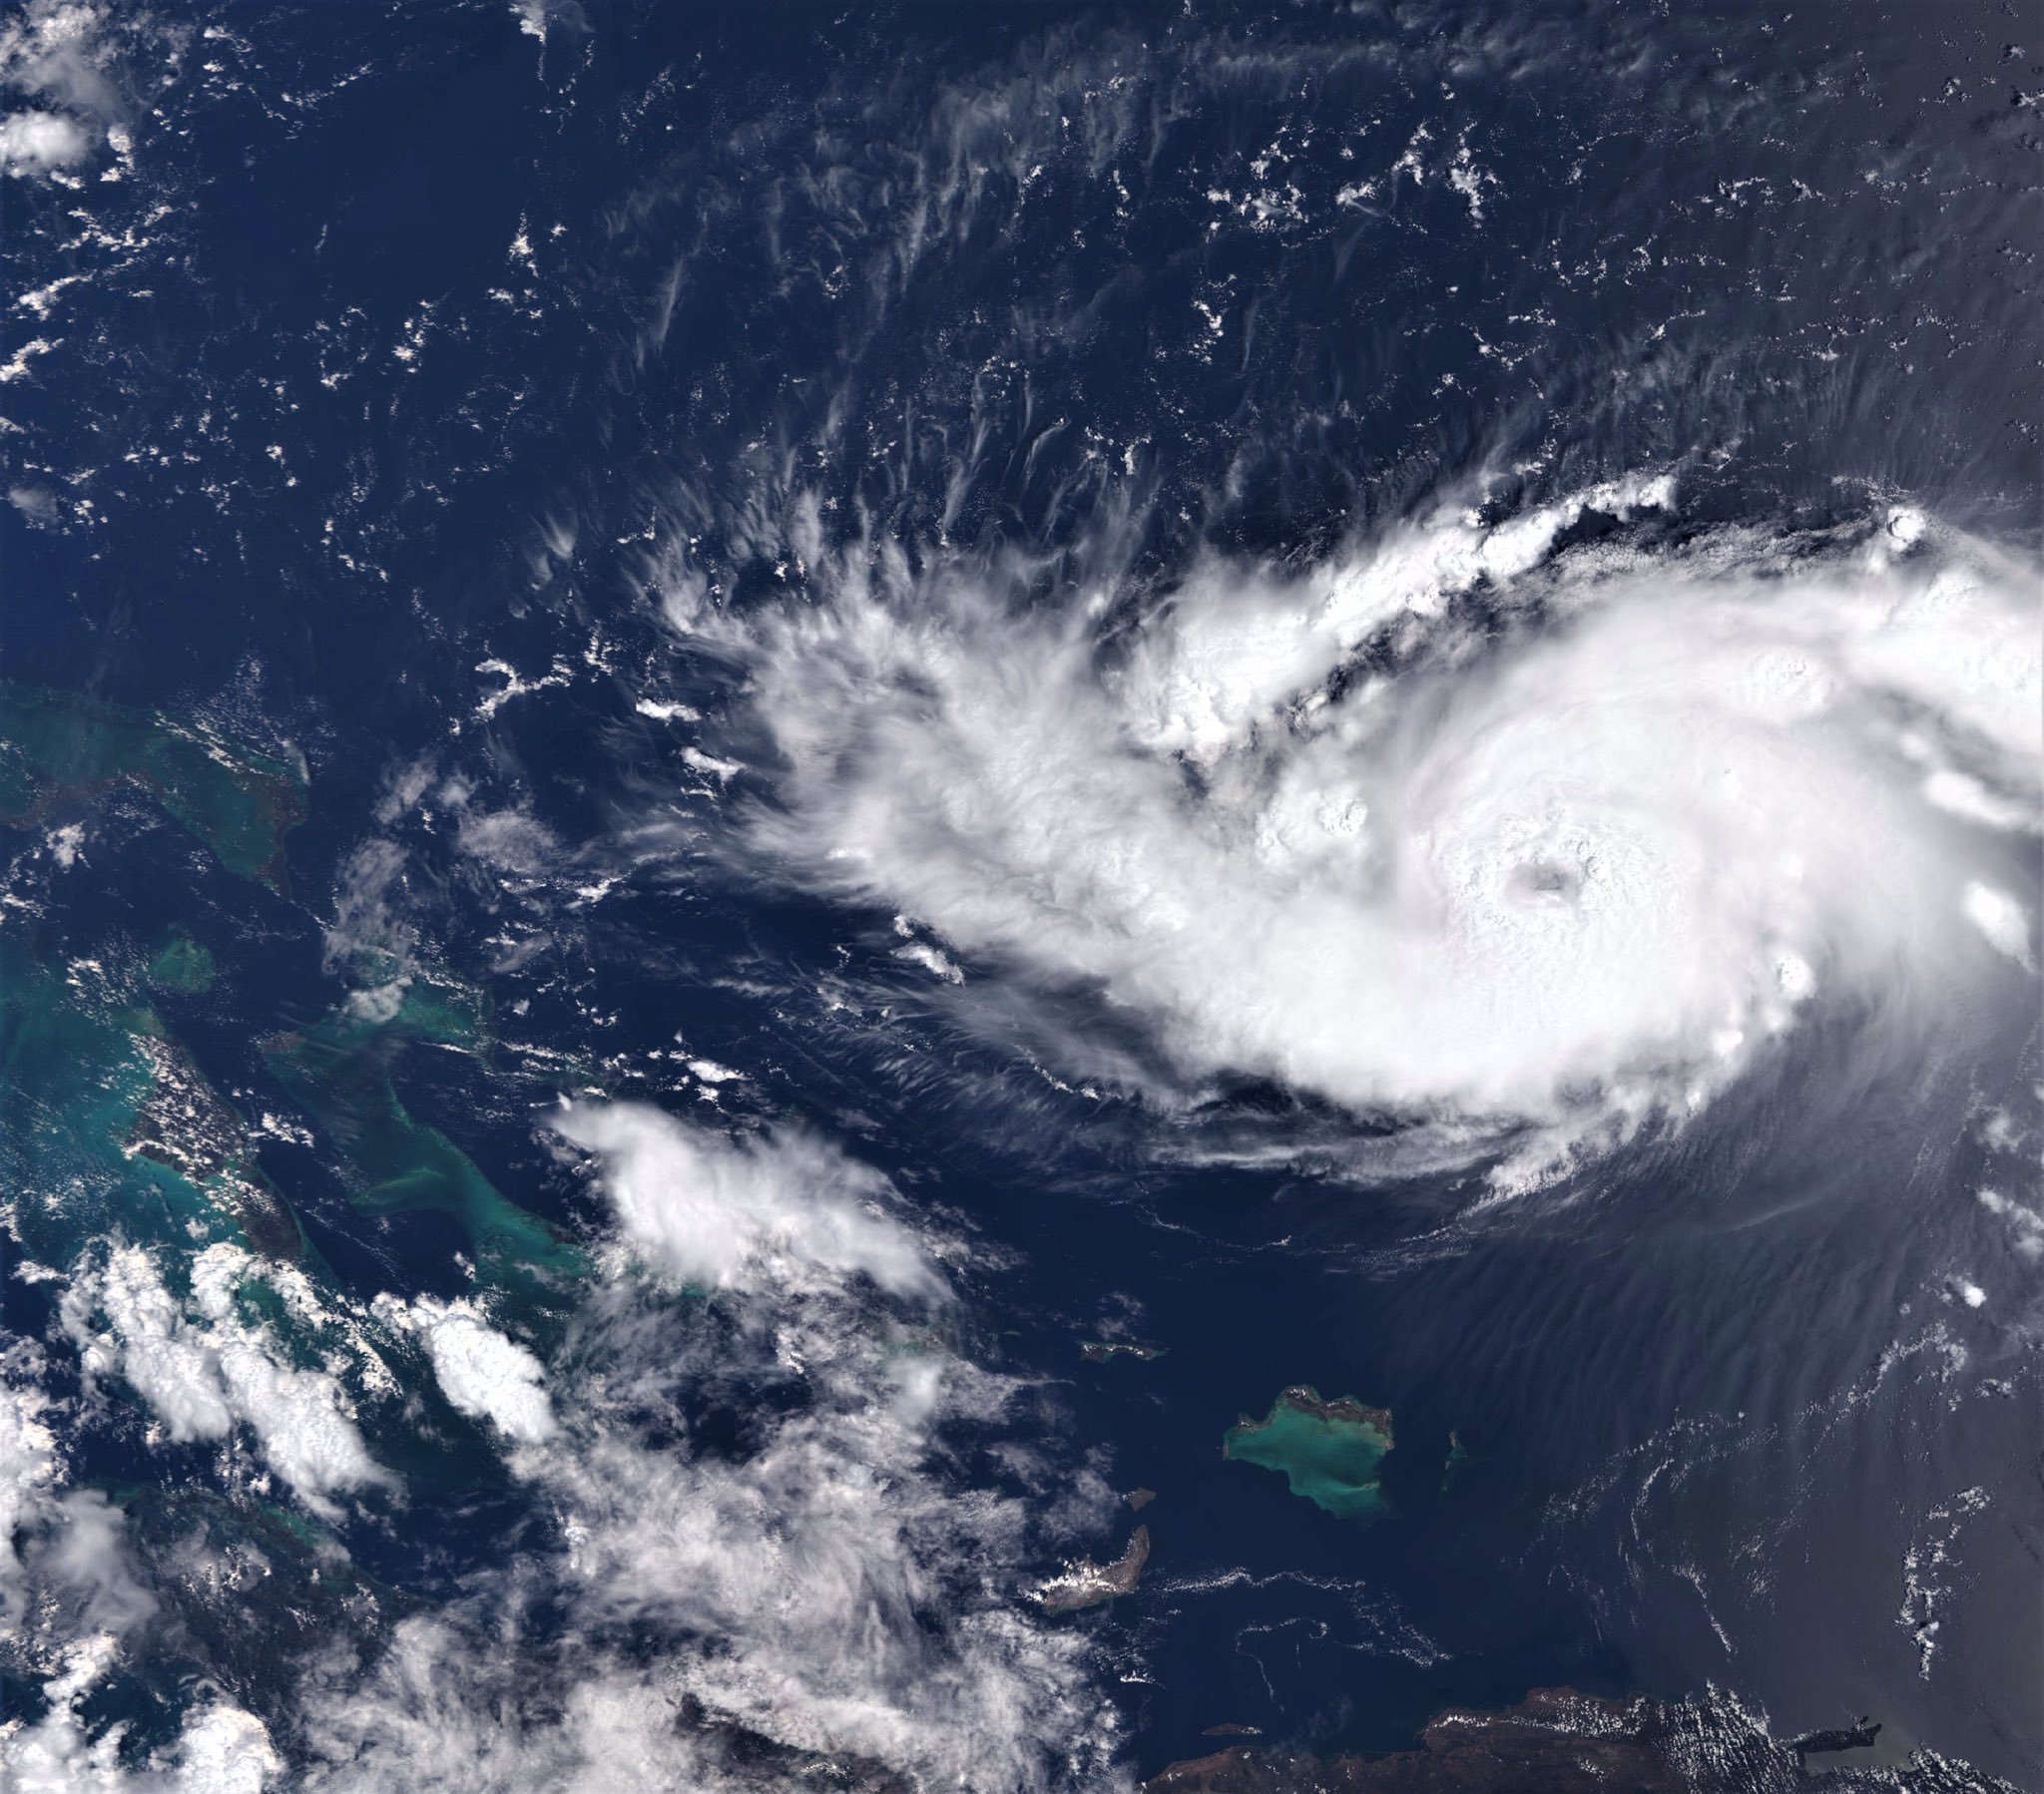
- Update Article was updated with Copernicus Sentinel3’s imagery (see below)
- Update Extremely dangerous hurricane Dorian, stenghtened to Category 3, is heading to northwestern Bahamas. A Hurricane Warning is in effect for northwestern Bahamas excluding Andros Island, a Hurricane Watch is in effect for Andros Island. At 5:00 p.m. EDT (9:00 p.m. UTC), the well-defined eye of Hurricane Dorian was located near 25.0N, 70.7W. On this track, the core of Dorian should move over the Atlantic well north of the southeastern and central Bahamas tonight and tomorrow, be near or over the northwestern Bahamas on Sunday, and be near the Florida east coast late Monday. Maximum sustained winds were near 115 mph (185 km/h) with higher gusts (Hurricane Dorian Advisory #26 by NWS National Hurricane Center Miami FL).
- Update Click to view the 64kt wind speed probabilities forecast (Advisory #25) over the last 12 hrs satellite loop (or any Windy forecast layer)
- Update At 11:00 a.m. AST (3:00 a.m. UTC), the eye of Hurricane Dorian was located near 24.5N, 69.8W. A slower west-northwestward to westward motion should begin tonight and continue into early next week. Dorian should move over the Atlantic well north of the southeastern and central Bahamas today and tomorrow, be near or over the northwestern Bahamas on Sunday, and be near the Florida peninsula late Monday. A Hurricane Watch is in effect for Northwestern Bahamas.
- Update Hurricane Hunters find Dorian a little stronger. Check out the NHC's hurricane Dorian Intermediate Advisory 24A cone and track (click here).
- Update: At 5:00 p.m. AST (9:00 p.m. UTC), the center of Hurricane Dorian was located near 22.5N, 67.7W, with maximum sustained winds near 85 mph (140 km/h). Check out the latest cone and track by NHC (Public Adv. 22)
- Update: Hurricane Dorian continues to gain intensity. The National Hurricane Center forecasts it will become a major hurricane (Category 3 or 4) by Friday. At 11:00 a.m. AST (3:00 p.m. UTC), the center of Hurricane Dorian was located near 21.4N, 67.2W, with maximum sustained winds near 85 mph (140 km/h). A west-northwestward motion is forecast to begin by Friday night and continue into the weekend. On this track, Dorian should move over the Atlantic well east of the southeastern and central Bahamas today and on Friday, approach the northwestern Bahamas Saturday, and move near or over portions of the northwest Bahamas on Sunday. Dorian is expected to become a major hurricane on Friday, and remain an extremely dangerous hurricane through the weekend.
- Update: On August 28th 11:00 p.m. AST (3:00 a.m. UTC), the center of Hurricane Dorian was located near 19.7N, 66.0W. Dorian is moving toward the northwest near 13 mph (20 km/h), and this general motion is expected to continue through Friday. Click here to get the latest NHC's cone & track (Adv. 19) displayed on any Windy forecast layer.
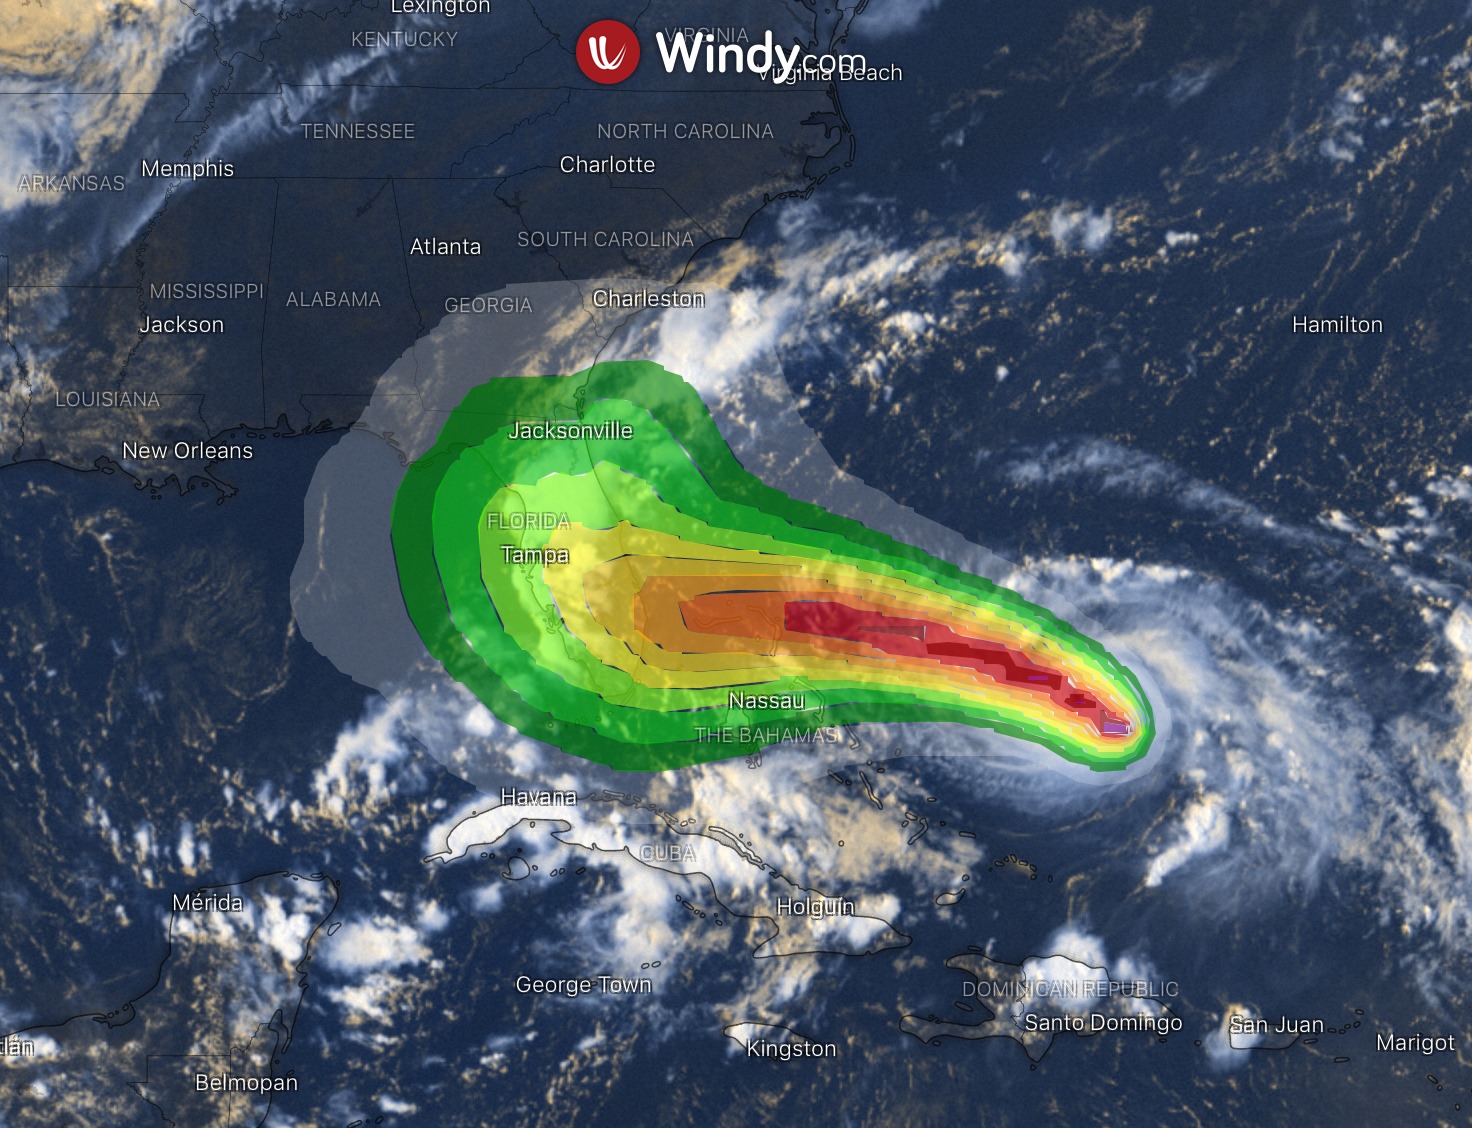
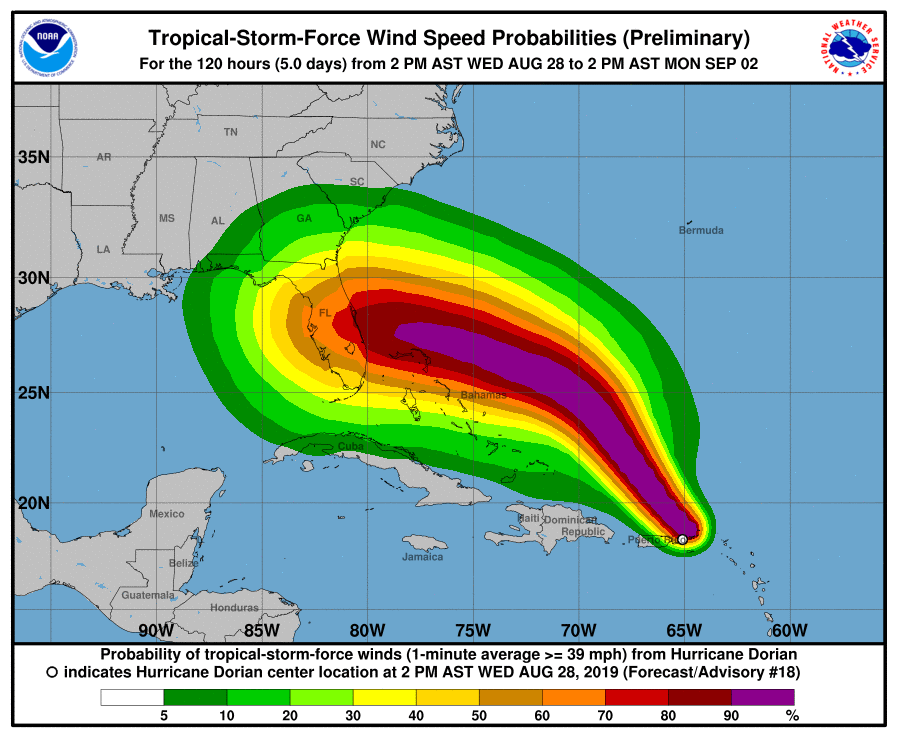
- Update: Check out the earliest reasonable arrival time of tropical storm force winds from Adv.18 by NOAA/NHC over last 12 hours satellite loop (you can switch to any forecast layer too). Click here.

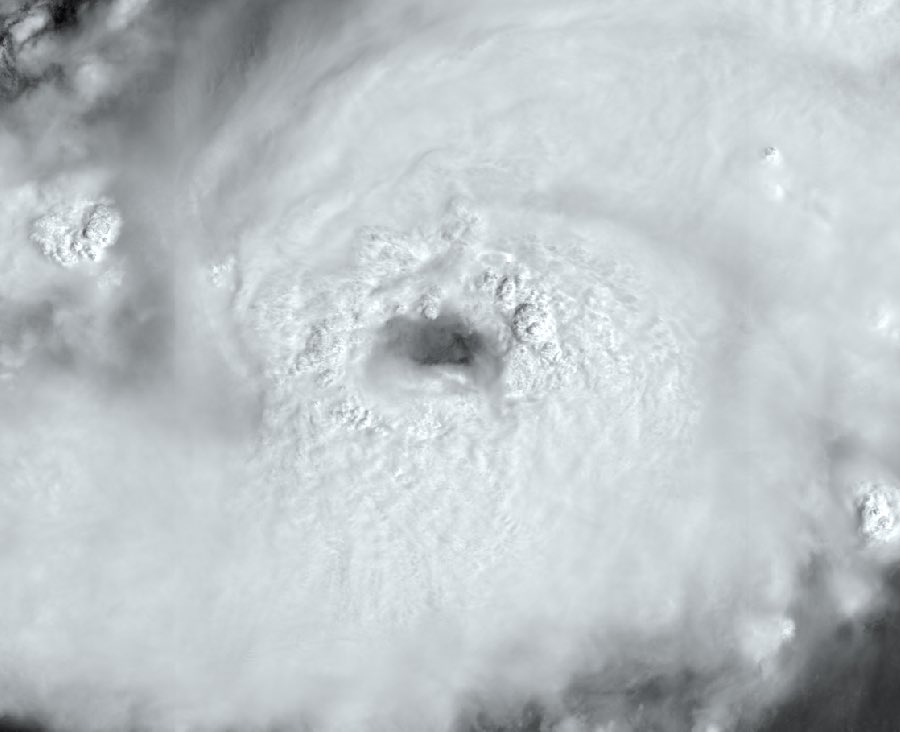
- Update: At 5:00 p.m. AST (9:00 p.m. UTC), the apparent eye of Hurricane Dorian was located near 18.8N, 65.5W. Dorian is moving toward the northwest near 14 mph (22 km/h). On this track, Dorian should continue to move near or over the U.S. and British Virgin Islands during the next several hours and then move over the Atlantic well east of the southeastern Bahamas on Thursday and Friday. Maximum sustained winds have increased to near 80 mph (130 km/h) with higher gusts. Dorian is forecast to strengthen and become a powerful hurricane during the next few days over the Atlantic waters.
- Update: Dorian strengthened to Category 1 hurricane earlier this afternoon
31 August 2019
30 August 2019
- Click here to view the 64kt wind speed probabilities forecast (Advisory #25) over the last 12 hrs satellite loop (or any Windy forecast layer)
29 August 2019
We just released the first special weather balloon in support of #HurricaneDorian. Our office is one of 18 across the Southern US doing these special, 6-hourly, releases. Data acquired from these flights will help improve the forecast for #Dorian. —NWS Brownsville
28 August 2019
Full day 1 min res. GOES-16 loop
Tropical Storm Dorian is forecast to develop into a Category 2 hurricane after making landfall in Puerto Rico.
The National Hurricane Center (NHC) expects the tropical storm conditions in Puerto Rico, with the possibility of hurricane conditions, but over the weekend the storm may strengthen to a Category 2 hurricane as it moves toward the east coast of Florida.
After hitting Puerto Rico, which is still recovering from Hurricane Maria in 2017, Dorian is forecast to strengthen into a Category 1 hurricane by Friday morning.
Dorian si forecast to strengthen again throgh Sunday morning, before arriving at Florida's coast and making landfall as a Category 2 hurricane late Sunday or Monday along the east coast of Florida.
The NHC has issued hurricane watch and tropical storm warnings for Puerto Rico and the Dominican Republic.
A Hurricane Warning
- Vieques and Culebra
- U.S. Virgin Islands
- British Virgin Islands
A Hurricane Watch and a Tropical Storm Warning
- Puerto Rico
A Tropical Storm Watch
- Dominican Republic from Isla Saona to Samana

The governor of Puerto Rico has declared a state of emergency for US territory on Monday.
Based on the current track of Tropical Storm Dorian, all residents on the East Coast should prepare for impacts, including strong winds, heavy rain and flooding. Make sure to have your supplies ready and follow @FLSERT (Florida Division of Emergency Management) and local media for the latest updates on the forecast. —Ron DeSantis, governor of Puerto Rico
Yesterday, the US president has approved an emergency declaration.

- Track the path of Dorian with Windy Hurricane Tracker: http://bit.ly/dorian_tracker
https://www.windy.com/upload/5d7424970ba7fc001941fe63?satellite,29.037,-80.859,4,internal


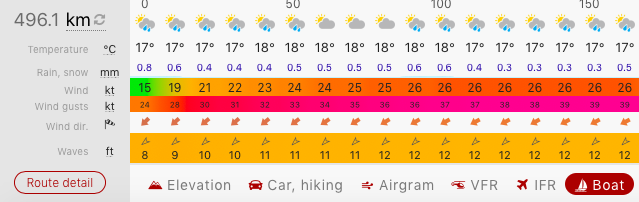
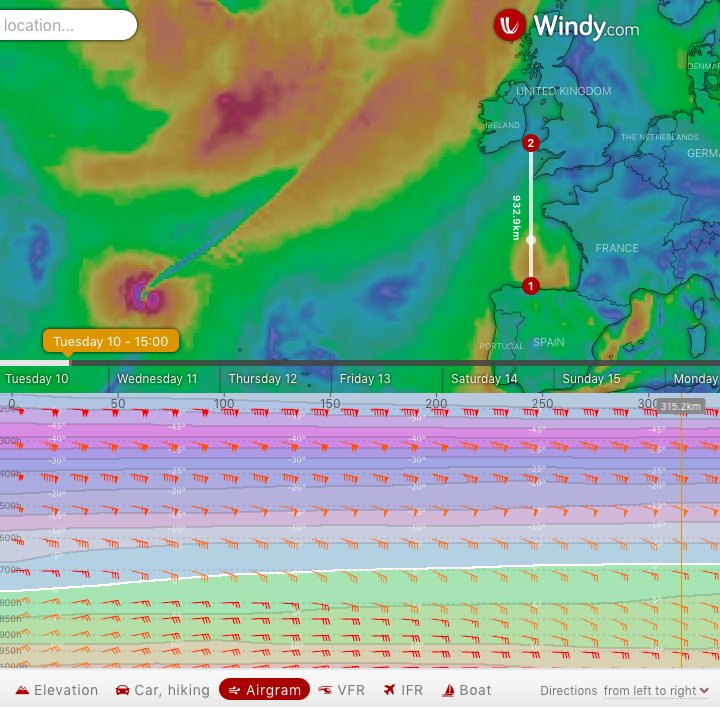
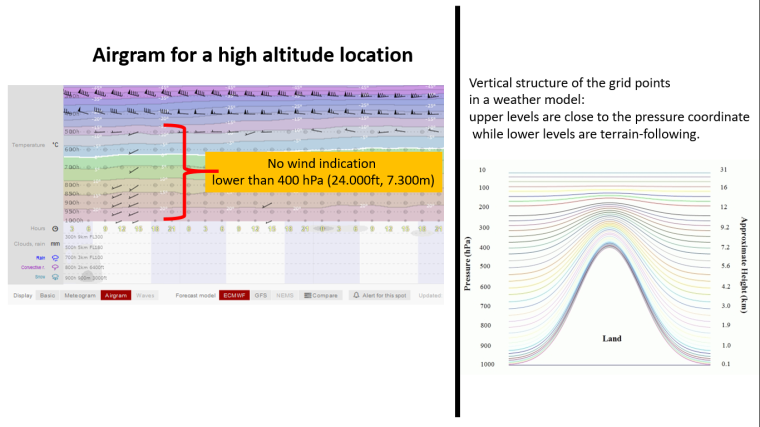 @Gkikas-LGPZ;desc:Airgram;licence:cc;" class=" img-fluid img-markdown" />
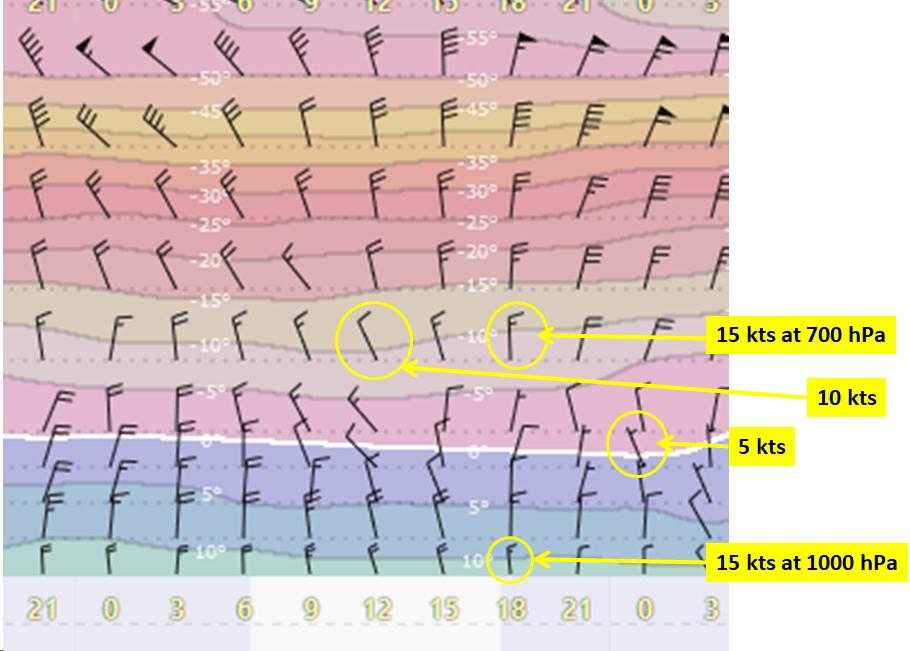 @Gkikas-LGPZ;licence:cc;" class=" img-fluid img-markdown" />
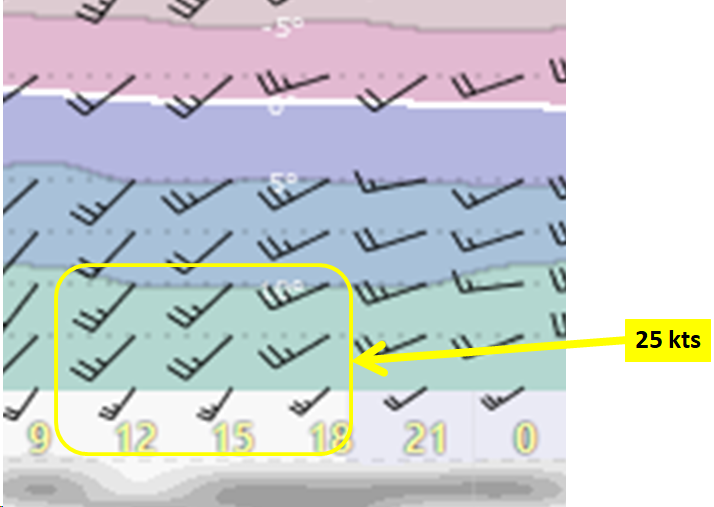 @Gkikas-LGPZ;licence:cc;" class=" img-fluid img-markdown" />
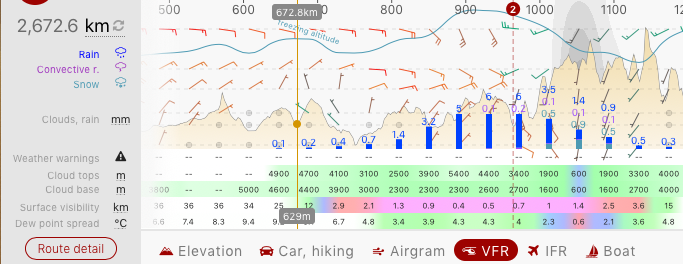


 @rittels;" class=" img-fluid img-markdown" />
 @rittels" class=" img-fluid img-markdown" />
 @rittels" class=" img-fluid img-markdown" />
 @rittels" class=" img-fluid img-markdown" />
 @rittels" class=" img-fluid img-markdown" />
 @rittels" class=" img-fluid img-markdown" />


 @windyforecast), Twitter (


