Windy Community
    • Unread
    • Categories
    • Groups
    • Go to windy.com
    • Register
    • Login
    1. Home
    2. TomSlavkovsky
    3. Best
    T
    Offline
    • Profile
    • Following 7
    • Followers 108
    • Topics 86
    • Posts 768
    • Groups 2

    Posts

    Recent Best Controversial
    • New satellite map enhancements

      Several months ago, we launched an extraordinary satellite map. Now we are testing a new version of the satellite map, which brings new stunning enhancements:

      • Stunning and realistic colours. Clouds and land look now real as from the ground
      • More level of details. Windy now generates data at zoom 7 for GEOS and Himawari satellite, which makes satellite even better. Just check the cloud tops over America and Asia
      • The new colour scale for infra+ view
      • Data optimization. Your device now downloads only new images during the animation

      Please, help us test it out, before it goes to the production - click here.

      https://www.windy.com/-Satellite-satellite2?satellite2,36.368,-93.691,5,internal

      posted in Articles article feature new windy
      T
      TomSlavkovsky
    • Copernicus Atmosphere Monitoring Service (CAMS) data and forecast are now accessible on Windy.

      World Environment Day: Global air quality data and forecasts from the Copernicus Atmosphere Monitoring Service (CAMS) are now accessible on Windy.

      Following a partnership agreement, over 800,000 users of the popular weather application, Windy, can now access global air quality information provided by the Copernicus Atmosphere Monitoring Service (CAMS). CAMS is implemented by the European Centre for Medium-Range Weather Forecasts (ECMWF) on behalf of the European Union.

      As a result of the collaboration, CAMS’ forecasts of the surface concentrations of the two main air pollutants, nitrogen dioxide and fine particulate matter, have been integrated into Windy. In addition, CAMS Aerosol Optical Depth forecasts are also featured on the app, allowing users to track the paths of plumes of fine particulate matter from a variety of sources around the planet, including dust, biomass burning, pollution, sea sprays and volcanic eruptions. Finally, CAMS’ forecast of the Earth’s ozone layer are also available in Windy.

      
photo: Copernicus;
license: cc;
desc: Tomáš Zámečník, Windy Board Member and Vincent-Henri Peuch, Head of CAMS;

      Windy already uses information from ECMWF to provide its users with a range of weather parameters including wind, rain, lightning and cloud types. Air quality is a major concern throughout the world, contributing to around 400,000 premature deaths across the European Union each year, and easy access to air quality forecasts is now more important than ever before. Windy’s global reach will help bring much-needed CAMS air quality data to businesses, governments, organisations and individuals throughout the world via its simple and highly-visual application.

      
photo: Windy;
license: cc;
desc: Nitrogen dioxide levels (NO2) over Europe, 4 June 2019, 13.00h. Source: Windy using CAMS data;

      Following the new initiative with CAMS, Windy.com is one of the first of its kind to offer consistent air quality and winds forecasts in a fast, clear and understandable animation format, providing easy-to-access insight for businesses and individuals into the air we breathe. Visualising winds and air pollution at the same time is highly relevant, as winds drive the transport of pollutants and the absence of wind is a key factor for the accumulation of pollutants and the development of pollution episodes. Just like CAMS data, the app is provided free of charge to everyone without any advertising. It is available on all platforms including iOS, Android and desktop.

      This is just one of a number of related projects supported by CAMS, which was set up as part of the European Union’s Copernicus Earth Observation Programme. The service provides freely-available global data on air quality, solar energy, greenhouse gas emissions, the ozone layer and more. CAMS combines computer models of the atmosphere, similar to those used for weather forecasts, with satellite and in-situ observations to provide daily forecasts of the composition of the air throughout the world.

      
photo: Windy;
licence: cc;
desc: Plumes of particular matter (PM2.5) over Asia, 3 June, 2019, 16.00h. Source: Windy using CAMS data;

      Ivo Lukačovič, founder of Czech-based start-up Windy, comments: “Following our partnership agreement with CAMS, we are delighted to have completed the integration process to include much-needed air quality data from the organisation. At Windy, we are committed to providing information in a clear format that everyone can understand and even with increasing amounts of data to process and display, the app is incredibly fast as well as being user-friendly.”

      Vincent-Henri Peuch, Head of the Copernicus Atmosphere Monitoring Service, adds: “We are delighted that Windy has now integrated CAMS data, so that its many users can now access our global and European air quality forecasts. To help inform, mobilise and eventually combat air pollution, air quality forecasts need to become as common as weather forecasts. The way Windy visualizes data from CAMS helps people to understand that air pollution is not simply a local problem, but can be transported for hundreds or thousands of kilometres by winds. On Windy, users and businesses can easily follow where air pollution is transported and where it accumulates.”

      The newly integrated CAMS data can be found on Windy.com.
      Nitrogen dioxide
      Particulate matter
      Aeorosol optical depth
      Ozone layer

      https://www.windy.com/annotation/5cf79d2ae27361001967c7b3

      https://www.windy.com/annotation/5cf79d63e27361001967c7b4

      https://www.windy.com/annotation/5cf79caae27361001967c7b1

      https://www.windy.com/annotation/5cf79ccfe27361001967c7b2

      posted in Articles article copernicus new feature new
      T
      TomSlavkovsky
    • New map on Windy: Active fires

      At Windy, we have extended our partnership with Copernicus, and I am happy to announce that we have added a new map to Windy - "Active fires".

      Active fires are provided by the Copernicus Global Fire Assimilation System (GFAS). Adding fire maps is an excellent addition to our current environmental maps. The active fires map represents thermal radiation measured from space-borne sensors and detected as coming from actively burning vegetation and other open fires.

      It is expressed as the daily average of the fire radiative power (FRP) observations made in 125 km grid cells and expressed in the units of [mW/m2]. The rate of release of thermal radiation by a fire is believed to be related to the rate at which fuel is being consumed and smoke produced.

      To open the map just select Active fires in the list of all maps. Moreover, you can open Active fires points from the list of POIs at the bottom right-hand box on any Windy map, including the last 12 hours satellite (very useful). Hovering over the fire icon gives you additional information.

      The Active Fires POI layer is not available from mobile devices.

      https://www.windy.com/-Active-fires-fires?fires,-31.020,152.380,7,internal

      posted in Articles article video copernicus gfas active fires
      T
      TomSlavkovsky
    • Add your Personal Weather Station on Windy

      For a very long time, our users asked us how to add personal weather station to Windy. In February, we asked our users what station they use and we received great feedback from our community. Therefore, we added the priority, and now we are pleased to announce that the Windy Stations are now live.

      To ensure broad compatibility between different manufacturers of personal weather stations we have inspired ourselves by already existing solutions. It should be straightforward for you to set up the stream if you already send the data somewhere else.

      Please bear in mind that this's still early beta version and all data might be deleted. However, we'll do our best not to. Also, send us the maximum amount of data even though we will not display them now. We will evaluate all the received data, and we might add them later.

      Here is a detailed manual about how to send us the data.

      You can register your weather station here.

      posted in Announcements article announcement
      T
      TomSlavkovsky
    • Several issues with upgrade to iOS 13

      With the introduction of iOS 13, we discovered that on some devices, the panning and zooming do not work as expected. After initial testing, it seems that if you switch off the 3D touch, then it should work correctly.

      To switch off you need to go to Settings -> Accessibility -> Touch -> 3D & Haptic Touch -> switch off "3D touch". Alternatively, you can search for 3D Touch.

      
photo:Windy.com
desc:How to disable 3D Touch.;

      Additionally, it is not possible to open the menu with Airsounding and Route planner because the long touch does not work.

      We are still investigating the problems so if you experienced issues with panning and zooming let us know. Also, tomorrow, Apple will release iOS 13.1, it might fix those issues on Windy application. So let us know if something changes with updating the iOS to 13.1.

      posted in Articles article
      T
      TomSlavkovsky
    • When and how often are the weather data updated?

      The table below describes when and how often are the weather models updated. All times are in UTC.

      Model / Runtime Update interval 0:00 6:00 12:00 18:00
      ECMWF 0.1° 12h (6hr in Premium) 00:00 06:00 12:00 18:00
      GFS 6h 00:00 06:00 12:00 18:00
      NESDIS 5 days - - -
      WaveWatch3 6h 06:00 12:00 18:00 00:00
      NEMS Europe 12h 08:30 - 20:30 -
      NAM CONUS 6h 04:15 10:15 16:15 22:15
      NAM Alaska 6h 03:15 09:15 15:15 21:15
      NAM Hawaii 6h 04:15 10:15 16:15 22:15
      ICON-EU 6h 04:30 10:30 16:30 22:30
      ICON-D2 6h 02:30 8:30 14:30 20:30

      Shortened version of this link: on.windy.com/WeatherDataUpdate

      posted in Frequently Asked Questions
      T
      TomSlavkovsky
    • How to Calculate Sunrise and Sunset

      To compute sunrise and sunset times is easy, you just need to apply the following formula:

      formula sunrise.jpg

      where:
      ωo is the hour angle in degrees at either sunrise (when negative value is taken) or sunset (when positive value is taken) in degree (°)
      φ is the latitude of the observer on the Earth in degrees
      δ is the sun declination in degrees

      Alternatively, you can use sunrise/sunset times on Windy.

      
author:windy.com;
licence:cc;
link:https://www.windy.com;

      Following contour plot shows hours of daylight based on latitude and day of the year.

      
licence:cc;
link:https://en.wikipedia.org/wiki/Sunrise_equation#/media/File:Hours_of_daylight_vs_latitude_vs_day_of_year_cmglee.svg;
desc: A contour plot of the hours of daylight as a function of latitude and day of the year, using the most accurate models described in this article. Latitude 40° N (approximately New York City, Madrid and Beijing) is highlighted for reference.;

      For more information about sunrise & sunset, I recommend Astronomical Applications Department of the U.S. Naval Observatory website.

      posted in Articles article
      T
      TomSlavkovsky
    • February 2019 Climate Update by Copernicus

      Copernicus released its February 2019 Climate update.

      • In February the global temperature was well above average.
      • Conditions in the US notably California were quite wet while the southern hemisphere was generally drier than average. Queensland in Australia was the exception after rain led to large-scale flooding.
      • In Europe, February began with lower than average temperatures. Heavy snowfall in Bosnia resulted in severe flooding and landslides.
      • By the end of the month, conditions were dry and extremely warm for the time of year. France, Spain and Romania all saw wildfires.
      • Sea ice is decreasing globally especially in the Arctic. In the Antarctic, there is no such trend though sea ice for February has been below average for the last four years.

      
photo: Euronews;
desc: Copernicus Climate Update February 2019.

      You can find full version of the article published by Copernicus Atmosphere Monitoring Service here.

      posted in Articles article climate change climate update copernicus video
      T
      TomSlavkovsky
    • World’s hottest June on record

      Summer has barely begun, but temperature records are already being broken. Data released today show that the European-average temperature for June 2019 was higher than for any other June on record. Average temperatures were more than 2°C above normal and it has become the hottest June ever recorded.

      Although not as persistent as that of summer 2018, this short heat wave, caused by a mass of hot air coming from the Sahara Desert, was intense. The five days of unusually high temperatures followed days with record-breaking temperatures further east in Europe. This led to the month as a whole being around 1°C above the previous record for June, set in 1999, and about 1°C higher than expected from the trend in recent decades.

      Data provided by the Copernicus Climate Change Service (C3S), implemented by the European Centre for Medium-Range Weather Forecasts on behalf of the European Union, show that the global-average temperature for June 2019 was also the highest on record for the month. It was about 0.1°C higher than that of the previous warmest June, in 2016, following a strong El Niño event.

      The map of temperature anomalies shown above, based on the latest C3S data, highlights just how unseasonably warm the end of the month was. Compared to the average for the same five days during 1981-2010 (the standard 30-year climatological reference period), temperatures of 6-10°C above normal occurred over most of France and Germany, northern Spain, northern Italy, Switzerland, Austria, and the Czech Republic.

      
desc:Average June temperatures (°C) for Europe (top) and globally (bottom) from 1979 to 2019, shown as differences from long-term average values for 1981 to 2010. June 2019 is highlighted. Data source: ERA5.
photo:ECMWF, Copernicus Climate Change Service;

      Although it is difficult to directly attribute this heat wave to climate change, such extreme weather events are expected to become more common as the planet continues to warm under increasing greenhouse gas concentrations.

      Looking at the temperature data from a longer-term perspective reveals the month to be even more unusual. Merging the latest C3S data with datasets that extend further back in time shows that the June 2019 European-average temperature was more than 3°C higher than the average for 1850-1900.

      
desc:Average June temperatures (°C) for Europe (top) and globally (bottom) from 1880 to 2019, shown as differences from long-term average values for 1850 to 1900. June 2019 is highlighted.;
photo:ERA5 (ECMWF, Copernicus Climate Change Service) and HadCRUT4 (Met Office Hadley Centre and Climatic Research Unit, University of East Anglia).;

      Spikes in European-average June temperature of more than 1°C above normal have occurred several times during the last 150 years; in 1901 and 1917, as well as 1999, for example. The temperature in June 2019 was exceptional because its spike came on top of a general rise of around 1.5°C or more in European temperature over the past one hundred years. This rise in European temperature is notably higher than that of around 1°C seen globally.

      Jean-Noël Thépaut, Head of the Copernicus Climate Change Service (C3S), comments: “Although local temperatures may have been lower or higher than those forecast, our data show that the temperatures over the southwestern region of Europe during the last week of June were unusually high. Although this was exceptional, we are likely to see more of these events in the future due to climate change.”

      posted in Articles article copernicus climate change clima heatwave
      T
      TomSlavkovsky
    • Disputed territories on Windy

      Windy uses data from Open Street Maps for our base maps.

      What is on OSM, we use. If you think that something is not correct, please report it at www.openstreetmap.org or correct it.

      Also we are aware that there is a lot of wars and territorial disputes all over the world. Therefore companies like Google, Bing, Apple, and Yandex have a different version of its maps, and they present the "right maps" to the "right audience".

      We are focused on good weather product and we have absolutely no resources to present different maps to different countries.

      Please accept it.

      These are the disputed territories around the world:

      disputed territories


      Shortened version of this link: on.windy.com/DisputedTerritories


      UPDATE on Vietnamese map issue (9 Nov 2018)

      Please note, the label that we display on Windy was deleted from the OpenStreetMap database just yesterday (see the screenshot below).

      When we next generate labes to Windy (we can not guarantee when it will be), the change will take effect, unless some other OSM contributor makes a contradictory editing in the meantime.

      Also please note: For every language, a different label can be displayed. For example, in Vietnamese we show "Tam Sa", while in English it's "Sansha" – just according to the translation available on OSM.

      We hope this explanation has brought more light into the "wrong maps" issue. :)


      0_1541758941137_hoangsa.png


      posted in Frequently Asked Questions
      T
      TomSlavkovsky
    • WMO Statement on the State of the Global Climate

      Every year, WMO issues a Statement on the State of the Global Climate based on data provided by National Meteorological and Hydrological Services (NMHSs) and other national and international organizations. Here are the highlights from the report:

      2018: Fourth Warmest Year

      2018 is on course to be the fourth warmest year on record. This means that the past four years—2015, 2016, 2017 and 2018—taken together are the four warmest years on record. In contrast to the other top warmest years, 2018 began with La Niña conditions, which are typically associated with lower global temperatures.
      
photo: UK Met Office Hadley Centre;
desc: Global mean temperature anomalies with respect to the 1850-1900 baseline, for the five global datasets.;

      Greenhouse Gas Concentrations Continue to Rise

      Levels of carbon dioxide concentrations continued to increase in 2018. Atmospheric concentrations reflect a balance between emissions due to human activities and the net uptake by the biosphere and oceans. Increasing levels of greenhouse gases in the atmosphere are key drivers of climate change.
      
photo: WMO;
desc: Increase in atmospheric carbon dioxide concentrations in parts per million (ppm).;

      Sea Level Rise Continues

      Mean Global Mean Sea Level for the period from January to July 2018 has been 2 to 3 mm higher than for the equivalent period in 2017.
      
photo: WMO;
desc: Global Mean Sea Level.;

      Ocean Heat Content at Record High

      More than 90% of the energy trapped by greenhouse gases, goes into the oceans. Ocean Heat Content provides a direct measure of the energy that accumulates in the upper layers of the ocean. For each three-month period in 2018, the ocean heat content in the upper 700m and upper 2000m were either the highest or second highest on record.
      
photo:NOAA/NESDIS/NODC Ocean Climate Laboratory;
desc: 0-700m Global Ocean Heat Content.;

      Ocean Acidification

      In the past decade, the oceans absorbed around 25% of anthropogenic carbon dioxide emissions. Absorbed carbon dioxide reacts with seawater and changes the pH of the ocean. This process is known as ocean acidification. Observations in the open-ocean over the last 30 years have shown a clear trend of decreasing pH. The IPCC Fifth Assessment report found that there was a decrease in the surface ocean pH of 0.1 units since the start of the industrial revolution (1750). Changes in pH are linked to shifts in ocean carbonate chemistry that can affect the ability of marine organisms such as molluscs and reef-building corals, to build and maintain shells and skeletal material. This makes it particularly important to fully characterise changes in ocean carbonate chemistry.
      
photo: WMO;
desc: Ocean Acidification.;

      Sea Ice Well Below Average

      Arctic sea-ice extent was well below average throughout 2018 and was at record-low levels for the first two months of the year. The annual maximum occurred in mid-March and the March monthly extent was 14.48 million square km, third lowest on record and approximately 7% below the 1981-2010 average. The Arctic sea-ice extent reached its minimum in mid-September. The September monthly sea-ice extent was 5.45 million square km, approximately 28% below average. This ranked as the 6th smallest September extent on record. The 12 smallest September extents have all occurred in the 12 years since 2007.
      
photo: UK Met Office;
desc: Arctic sea-ice extent difference from 1981-2010.;

      Antarctic sea-ice extent was also well below average throughout 2018. The annual minimum extent occurred in late February and the monthly average was 2.28 million square km, 33% below average and ranked record low in the C3S dataset and 2nd lowest in the NSDIC data. For the months February through August, the monthly extent ranked among the ten smallest on record. The Antarctic sea-ice extent reached its annual maximum extent in late-September and early-October. The September monthly average extent was 17.82 million square km, 4% below average and ranked within the 5th smallest.
      
photo: UK Met Office;
desc: Antarctic sea-ice extent difference from 1981-2010.;

      Glaciers are retreating

      In the hydrological year 2016/17, observed glaciers experienced an ice loss of 0.850 meter water equivalent (m w.e.). Preliminary estimates for 2017/18 indicate a similarly negative mass balance year with an ice loss of 0.7 m w.e. With this, seven out of the ten most negative mass balance years were recorded after 2010.
      
photo: WMO;
desc: Mass balance values in mm w.e., calculated as annual average or regional means based on the World Glacier Monitoring Service 'reference' glaciers with more than 30 ongoing observation years.;

      Photo: WMO;
desc: Summary of key Climate Indicators in 2018.;

      The whole report is available here and the source for highlights is here.

      posted in Articles article climate change wmo report video
      T
      TomSlavkovsky
    • ECMWF will upgrade quality for the ocean wave forecasts

      ECMWF is preparing to upgrade, which will boost the quality the ocean wave forecasts. The wave forecast will benefit from a new physics package and some other improvements. The change will be available in upgrade Cycle 46r1 later this year. The new forecast will be immediately available on Windy.

      The wave physics package models how the wind whips up waves, how different waves interact with each other, and how wave energy gradually dissipates.
      A new physics package based on work by Fabrice Ardhuin and collaborators has been adapted for use in the IFS and will be introduced at ECMWF later this year.
      “It improves forecasts, notably by reducing the energy of waves that have travelled a long way from where they were generated, and by slightly increasing wave height in the extratropical storm tracks,” says ECMWF wave forecast specialist Jean Bidlot.

      You can read a full article on the ECMWF website.

      posted in Articles article
      T
      TomSlavkovsky
    • Radar data needed! Help us with the data gathering

      As we are continuously improving Windy, we never stopped thinking to create radar layer. Unfortunately, there is not only one service provider, where we could go and just download the data from some FTP server. To illustrate the problem, on the image bellow you can see all the doppler radar listed by WMO.

      0_1491318338893_Screen Shot 2017-04-04 at 4.59.40 PM.png

      Each country has a very different policy regarding those data. For example, USA gives those data to public for free (you can expect those to be added soon), however most of the states are not so generous and are hiding those data. To keep Windy free of charge, we don't want to pay for the data.

      Therefore, I am asking for your help. Do you know which countries provide the radar data for free? And can you provide the FTP server to the data?

      Current state (April 2017):

      • USA - data for free
      • Europe - OPERA project - whole European composite, which is heavily paid
      • Netherlands offers the data for free

      Any help appreciated!


      Shortened version of this link: https://on.windy.com/RadarDataGathering


      EDIT: Current state (18th September 2018)

      Radar already implemented – check this table chart: https://community.windy.com/topic/6014/weather-radar-providers

      Work in progress:

      • Argentina: Added

      • Caribbean + Belize: added

      • Estonia: added

      • Greece: added

      • Italy: added

      • Canada: Southern part already implemented: https://community.windy.com/topic/3746/radar-data-needed-help-us-with-the-data-gathering/120
        https://www.canada.ca/en/environment-climate-change/services/weather-general-tools-resources/weather-tools-specialized-data/geospatial-web-services.html ;
        https://open.canada.ca/data/en/dataset/9ff979c5-a307-4224-bbcf-ecfe5a65e828 ;
        https://weather.gc.ca/radar/index_e.html ;
        https://weather.gc.ca/business/index_e.html ;
        https://weather.gc.ca/mainmenu/contact_us_e.html

      Links to other potential data/image providers:

      • Australia:

        • ftp://ftp.bom.gov.au/anon/gen/radar ;
        • http://www.bom.gov.au/catalogue/data-feeds.shtml ;
        • http://www.bom.gov.au/products/IDR022.loop.shtml#skip ;
        • http://www.bom.gov.au/australia/meteye ;
          (however: https://community.windy.com/topic/3746/radar-data-needed-help-us-with-the-data-gathering/80) ;
          (more links here: https://community.windy.com/topic/3746/radar-data-needed-help-us-with-the-data-gathering/83) ;
        • http://www.weatherzone.com.au/radar
      • Belarus + Russia (European part):

        • http://meteoinfo.by/radar ;
        • http://meteoinfo.by/radar/?q=UMMN
      • Brasil:

        • https://www.redemet.aer.mil.br (biggest source) ;
        • https://www.redemet.aer.mil.br/?i=facilidades&p=api-redemet ;
        • http://sinda.crn2.inpe.br/PCD/SITE/novo/site/index.php ;
        • http://www.inmet.gov.br/portal
        • http://tempo.cptec.inpe.br
        • http://sigsc.sc.gov.br/radarsc
        • http://www.funceme.br/app/radar/animacao/quixeramobim
        • http://alertario.rio.rj.gov.br/radar-meteorologico-do-sumare/imgens-recentes/
        • http://www.simepar.br/prognozweb/simepar/radar_msc
        • http://www.ipmet.unesp.br/#
        • https://www.climatempo.com.br/radar-sp
        • http://servicos.cptec.inpe.br/XML
          (more at: https://community.windy.com/topic/3746/radar-data-needed-help-us-with-the-data-gathering/78)
        • https://www.nssl.noaa.gov/projects/mrms/redirect (for Santa Catarina region)
      • Bulgaria:

        • http://www.weathermod-bg.eu
      • China:

        • http://www.nemcaac.cn/dbinfo/app/common/radar/index (Civil Aviation Weather Radar) ;
        • http://www.weather.com.cn/radar/index.shtml?CHN (China Weather Network Weather Radar)
      • Colombia:

        • http://meteorologia.aerocivil.gov.co/radar/index/aoi/CRM/Reflectividad de Base 0.5 deg
          (however: https://community.windy.com/topic/3746/radar-data-needed-help-us-with-the-data-gathering/130)
      • Croatia:

        • http://meteo.hr/podaci.php?section=podaci_mjerenja¶m=radari
      • Cuba:

        • http://www.met.inf.cu/asp/genesis.asp?TB0=PLANTILLAS&TB1=RADARES
      • Cyprus:

        • http://weather.cyi.ac.cy/en/radar
      • Hong Kong:

        • http://www.hko.gov.hk/wxinfo/radars/radarc_range1.htm
          (more info: https://community.windy.com/topic/6080/help-us-to-test-new-weather-radar-overlay/267)
      • Hungary:

        • https://www.idokep.hu/radar
        • https://www.metnet.hu/radarkep
        • https://www.met.hu/en/idojaras/aktualis_idojaras/radar
      • India:

        • http://www.imd.gov.in/pages/radar_main.php
      • Indonesia:

        • http://radar.bmkg.go.id/bmkg2/data/
      • Ireland:

        • https://www.met.ie
      • Israel:

        • http://www.ims.gov.il/IMSEng/Tazpiot/RainRadar.htm
      • Lithuania:

        • http://www.meteo.lt/lt/radaru-informacija
      • Mexico:

        • http://astro.iam.udg.mx/radar/index.html
        • http://smn.cna.gob.mx/es/observando-el-tiempo/radares-meteorologicos
      • New Caledonia:

        • http://www.meteo.nc
      • New Zealand:

        • https://about.metservice.com/our-company/about-this-site/open-access-data ;
        • http://www.metservice.com/maps-radar/rain-radar/all-new-zealand ;
        • https://about.metservice.com/contact ;
        • (or https://weather.niwa.co.nz)
      • Philippines

        • http://bantaypanahon.dost6.info/doppler.php
        • https://www1.pagasa.dost.gov.ph – both probably for watching only
      • Portugal:

        • http://www.ipma.pt/en/otempo/obs.radar ;
        • https://www.ipma.pt/en/otempo/obs.remote/index.jsp
      • Russia (Asian part):

        • http://orm.mipt.ru/RAD/dmrl.html
        • http://meteorad.ru/static/phenomena.gif
      • Serbia:

        • http://www.hidmet.gov.rs/index_eng.php
        • http://www.hidmet.gov.rs/eng/osmotreni/radarska.php
      • Slovenia:

        • http://www.arso.gov.si/vreme/napovedi in podatki/radar.html ;
        • http://meteo.arso.gov.si/met/sl/app/webmet/#webmet=vUHcs9WYkN3LtVGdl92LhBHcvcXZi1WZ09Cc1p2cvAncvd2LyVWYs12Lp1WYnV2Lp5Wa05CetxGfzx2b2VmbpF2XuVWanhmYvVnczxXatF2Zlx3ejxWZhJXThBHRhRXY6YWYsNXZsQ2btFWaupzJzx2b2VmbpF2JsAXYyFWblRXZypzJSFERBJ1XM9kTHdSf ;
        • https://www.si-vreme.com/si/slovenija/radarska-slika/padavine-zemljevid?xl=&xs=si-radarska_slika_map1&xt=3&fo=1#vsebina
      • South Africa:

        • http://www.weathersa.co.za
      • Switzerland:

        • https://www.meteoschweiz.admin.ch/home.html?tab=rain
      • Thailand:

        • http://weather.tmd.go.th/svp120.php
        • https://community.windy.com/topic/3746/radar-data-needed-help-us-with-the-data-gathering/86
      • Turkey:

        • https://mgm.gov.tr/eng/radar.aspx ;
        • https://www.mgm.gov.tr/sondurum/radar.aspx?rG=img&rR=34C&rU=max#sfB ;
        • https://www.mgm.gov.tr/sondurum/radar.aspx?rG=img&rR=00&rU=max#sfB
      • Ukraine:

        • http://meteoinfo.by/radar/?q=UKBB
        • https://meteo.gov.ua/ua/33345/radar
      • Tropical Atlantic:

        • http://tropicalatlantic.com/radars
      • Global radar resources:

        • https://www.nrl.navy.mil/radar/contact

      Some more links to check:

      • OPERA official EU radar composite (paid): http://eumetnet.eu/activities/observations-programme/current-activities/opera-radar-animation &
        http://eumetnet.eu/activities/observations-programme/current-activities/opera
      • Europe: http://meteocentre.com/radar/europe/?lang=en
      • Germany: https://www.wetteronline.de/regenradar?wro=true
      • France: https://fr.meteox.com/fr-fr/home/satelliteradar
      • Spain: https://community.windy.com/topic/3746/radar-data-needed-help-us-with-the-data-gathering/119
      • Korea: http://web.kma.go.kr/eng/weather/images/radar.jsp
      • https://registry.opendata.aws/noaa-nexrad
      • https://www.nssl.noaa.gov/projects/mrms/redirect
      posted in General Discussion
      T
      TomSlavkovsky
    • Weather Radar Providers

      Following table summarizes all the radar data providers available on Windy. If you knew about other available radar data, please send us info.

      World:

      Country Abbreviation NMHS NMHS Web of NMHS
      CA Canada
      JP Japan JMA Japan Meteorological Agency http://www.jma.go.jp/jma/indexe.html
      US USA NOAA National Oceanic and Atmospheric Administration http://www.noaa.gov
      TW Taiwan CWB Central Weather Bureau https://www.cwb.gov.tw/eng/index.htm
      AR Argentina SMN Servicio Meteorológico Nacional https://www.smn.gob.ar

      European Countries:

      Country Abbreviation NMHS NMHS Web of NMHS
      CZ Czech Republic CHMU Czech Hydrometeorological Institute http://portal.chmi.cz/?l=en
      DE Germany DWD Deutscher Wetterdienst https://www.dwd.de
      EE Estonia
      FI Finland FMI Finnish Meteorological Institute Central forecasting http://www.fmi.fi
      FR France MF Météo-France http://www.meteofrance.com
      GB + IRL United Kingdom + Ireland Met Office https://www.metoffice.gov.uk
      GR Greece HNMS Hellenic National Meteorological Service http://www.hnms.gr/emy/en/index_html
      IT Italy ICP Italian Civil Protection Department http://www.protezionecivile.gov.it/jcms/en/home.wp
      NL Netherlands KNMI Royal Netherlands Meteorological Institute http://www.knmi.nl
      NO Norway MET Norway Norwegian Meteorological Institute https://www.met.no
      PL Poland IMGW Institute of Meteorology and Water Management http://www.imgw.pl
      RO Romania (+ Moldova) ANM National Meteorological Administration http://www.meteoromania.ro/anm2
      SK Slovakia SMHU Slovak Hydrometeorological Institute http://www.shmu.sk
      ES Spain AEMET Agencia Estatal de Meteorología http://www.aemet.es
      SE Sweden SMHI Swedish Meteorological and Hydrological Institute http://www.smhi.se/en
      posted in Frequently Asked Questions
      T
      TomSlavkovsky
    • Vote for the next feature on Windy!

      What innovation should we put on Windy next?

      1. Weather radar for Europe
      2. Widget for iOS app
      3. Warnings for Extreme weather

      Let us know below.

      posted in General Discussion
      T
      TomSlavkovsky
    • Scientists Say Calving Event on the Brunt Ice Shelf is Imminent

      While it’s difficult to predict exactly when the two growing cracks on Antarctica’s Brunt Ice Shelf will intersect and cause an iceberg to break off, scientists say a calving event is imminent.

      
photo: NASA EO image Joshua Stevens;
desc: Satellite image of the Brunt Ice Shelf.

      When it breaks off, Chris Readinger, a physical scientist at the U.S. National Ice Center (NIC), said the iceberg will likely cover nearly 700 square miles, which equates to approximately twice the size of New York City. While this sounds huge, Readinger noted that the physical size of the iceberg isn’t really that spectacular if you look at the extended history of icebergs that dates back to the 1970s.

      
photo: Chris Readinger/NIC;
desc: The above image shows the potential shape of the iceberg that could break off of Antarctica’s Brunt Ice Shelf.;

      “I don’t think it would even be in the top 20 of the biggest bergs,” Readinger added. “It’s a sizeable berg for sure, but it wouldn’t be historical in terms of size.”

      For comparison's sake, the Delaware-sized iceberg (known as A-68) that broke off of the Larsen-C Ice Shelf in July of 2017, measured approximately 2,250 square miles.

      While the physical size of the potential iceberg isn’t especially remarkable, the crack’s proximity to the British Antarctic Survey Halley VI Research Station is concerning.

      In 2012 researchers noticed a previously dormant crack, known as Chasm 1, beginning to extend toward the McDonald Ice Rumples, explained Christopher Shuman, a glaciologist with NASA’s Cryospheric Sciences Laboratory. Then, on Oct. 31, 2016, glaciologists spotted what’s become known as the Halloween Crack on a part of the Brunt Ice Shelf that previously hadn’t shown signs of rifting or cracking.

      As a result, Halley VI Research Station was relocated further inland during the region’s 2016-17 summer season to avoid being cut off from the rest of the Brunt Ice Shelf. Although the station was designed to operate year-round, the British Antarctic Survey decided to close its doors for the 2019 winter season because of unpredictable conditions caused by the growing crack on the ice shelf.

      Chasm 1 has been extending approximately 33 feet per day for the last few weeks, according to Bert Wouters, an Earth scientist at Utrecht University in the Netherlands. Now, it’s only a matter of time before Chasm 1 extends just a few more miles and releases an iceberg from the shelf. Once the calving event occurs, the fate of the remaining Brunt Ice Shelf is largely unknown.

      “We don’t know what this really means for the remaining ice in the Brunt,” Shuman explained. “The Halloween Crack itself separates a more northerly part of the Brunt from the part where Halley Station is, so we’re going to have to watch and see whether the Brunt continues to maintain contact with the McDonald Ice Rumples or has further break back along Chasm 2 as that may lead to more worrisome changes for the remaining ice.”

      So while it’s difficult to predict how this could affect the overall health of the ice shelf, Readinger says the NIC has a pretty good idea of where the iceberg will go when it breaks off.

      “It would likely enter the Weddell Gyre, which is the circular ocean current which is just east of the Antarctic Peninsula,” Readinger said. “If it gets in there and it stays floating and doesn’t get stuck on the ocean floor, it could circle around and then be out toward the Antarctic Peninsula in maybe a year or less.”

      Nearly 90 percent of an iceberg is actually below the surface of the water, so in a less exciting scenario, there’s always a chance it could get grounded or stuck on the ocean floor.

      Regardless of what happens, Readinger said scientists at the NIC will be using satellite imagery to track the new iceberg as long as it measures at least 26 square miles.

      
photo:Chris Readinger/NIC;
desc:Here you can see other named icebergs and the potential paths this new iceberg could take.;

      Currently, the NIC is tracking three named icebergs floating in the South Atlantic near Argentina so that cargo and passenger ships are aware of these potential hazards. Like all the others, this soon-to-be iceberg, the NIC will follow its whereabouts until it’s too small to be tracked. Then the remaining fragments will likely be tracked by South Atlantic countries like Argentina because they could still be considered hazardous for vessels in those waters.

      https://www.windy.com/annotation/5ca7522dade88d001cd025de

      posted in Articles article noaa
      T
      TomSlavkovsky
    • Surface air temperature for March 2019

      Temperatures over almost all of Europe were warmer in March 2019 than in the 1981-2010 average for the month. They were most above normal over the east of the continent, by more than 3°C in places. It was slightly colder than average over some more northern parts of Norway, Sweden and Finland.

      
photo:ECMWF, Copernicus Climate Change Service;
desc: Surface air temperature anomaly for March 2019 relative to the March average for the period 1981-2010. Source: ERA-Interim.;

      Temperatures elsewhere were considerably above average in several regions. This was particularly the case over Alaska and north-western Canada, and over central Siberia, with relatively high values extending over Kazakhstan, Mongolia and north-eastern China. Australia experienced its warmest March on record, with temperatures most above average over the state of Western Australia. Temperatures exceeded average values to a similar extent over much of southern Africa. Temperatures were also several degrees above normal in places around Antarctica, although on the whole there was a mix of regions with above- and below-average temperatures over the continent.

      Temperatures were substantially below average over south-western Canada and the central USA, and over much of Greenland and a region of above-average sea-ice cover to its east. Several other land regions experienced temperatures that were a little below average.

      Although regions of below-average temperature occurred over all major oceans, marine air temperatures were predominantly higher than average. It was especially warm compared with the long-term average over the Tasman Sea between Australia and New Zealand.

      
photo:ECMWF, Copernicus Climate Change Service;
desc:Surface air temperature anomaly for April 2018 to March 2019 relative to the average for 1981-2010. Source: ERA-Interim.;

      Temperatures averaged over the twelve-month period from April 2018 to March 2019 were:

      • much above the 1981-2010 average in the Arctic, peaking near Svalbard and over and bordering the Bering and Chukchi seas;
      • above average over almost all of Europe;
      • above average over other areas of land and ocean, especially so over central northern Siberia, Mongolia and north-eastern China, the Middle East, Australia, southern Africa and some parts of the Antarctic;
      • below average over several land and oceanic areas, including much of Canada and Greenland, parts of the North Atlantic and South Pacific, and other parts of the Antarctic.

      
photo: ECMWF, Copernicus Climate Change Service;
desc:Monthly global-mean and European-mean surface air temperature anomalies relative to 1981-2010, from January 1979 to March 2019. The darker coloured bars denote the March values. Source: ERA-Interim.;

      The global temperature was substantially above average in March 2019. The month was:

      • 0.67°C warmer than the average March from 1981-2010;
      • within 0.01°C of the temperature of March 2017, the second warmest March in this data record;
      • about 0.11°C cooler than March 2016, the warmest March on record.

      The largest anomalies in European-average temperatures occur in wintertime, when values can vary substantially from month to month. March 2019 had a European-average temperature 1.7°C above normal. In contrast, March 2018 had an average temperature almost 1.6°C below normal.

      
photo: ECMWF, Copernicus Climate Change Service;
desc: Running twelve-month averages of global-mean and European-mean surface air temperature anomalies relative to 1981-2010, based on monthly values from January 1979 to March 2019. The darker coloured bars are the averages for each of the calendar years from 1979 to 2018. Source: ERA-Interim.;

      Averaging over twelve-month periods smooths out the shorter-term variations. Globally, the twelve-month period from April 2018 to March 2019 was 0.45°C warmer than the 1981-2010 average. The warmest twelve-month period was from October 2015 to September 2016, with a temperature 0.64°C above average. 2016 is the warmest calendar year on record, with a global temperature 0.62°C above that for 1981-2010. The second warmest calendar year, 2017, had a temperature 0.53°C above average. The third warmest year, 2015, was warmer than 2018 by an insignificant margin: its temperature, like that of 2018, rounds to 0.43°C above the 1981-2010 average.

      0.63°C should be added to these values to relate recent global temperatures to the pre-industrial level defined in the IPCC Special Report on “Global Warming of 1.5°C”. Monthly temperatures over the past twelve months have been mostly in the range from 1.0 to 1.1°C above this pre-industrial level, but March 2019 reached 1.3°C.

      The spread in the global averages from various temperature datasets has been unusually large over the past two years or so. During this period the twelve-month average values presented here are higher than those from several independent datasets, by between 0.05°C and 0.15°C for the twelve months for which spread is largest. This is due partly to differences in the extent to which datasets represent the relatively warm conditions that have predominated over the Arctic and the seas around Antarctica. Differences in estimates both of sea-surface temperature elsewhere and of temperatures over land outside the Arctic have been further factors. There is nevertheless general agreement between datasets regarding:

      • the exceptional warmth of 2016, and to a lesser extent 2015, 2017 and 2018;
      • the overall rate of warming since the late 1970s;
      • the sustained period of above-average temperatures from 2001 onwards.

      There is more variability in average European temperatures, but values are less uncertain because observational coverage of the continent is relatively dense. Twelve-month averages for Europe were at a high level from 2014 to 2016. They then fell, but remained 0.5°C or more above the 1981-2010 average. Twelve-month averages have risen since then. The latest average, for the period from April 2018 to March 2019, is more than 1.5°C above the 1981-2010 norm. It slightly exceeds the value for the twelve-month period from July 2006 to June 2007, making the past twelve months the warmest twelve-month period on record for Europe.

      The average surface air temperature analysis homepage explains more about the production and reliability of the values presented here.

      posted in Articles article copernicus
      T
      TomSlavkovsky
    • Severe Weather in Europe: Large Hail and Heavy Rain Expected Across Europe

      Valid: Fri 21 Jun 2019 06:00 to Sat 22 Jun 2019 06:00 UTC
      Issued: Thu 20 Jun 2019 18:57
      Forecaster: GROENEMEIJER

      A level 2 was issued for parts of Northwest Ukraine and South and Central Belarus for large hail, severe wind gusts and very heavy rainfall.

      A level 1 was issued across parts of Finland, NorthWest Russia, Belarus, the Baltic States, Poland, Ukraine, Czechia, Slovakia, Hungary, the northern Balkans, North Italy, the Alpine countries, South Germany, Southeast France and Northeast Spain for large hail, heavy rain and locally for severe wind gusts.

      photo: ESTOFEX;
desc: Storm forecast valid Fri 21 Jun 2019 06:00 - Sat 22 Jun 2019 06:00 UTC.;
link: http://www.estofex.org/cgi-bin/polygon/showforecast.cgi?text=yes&fcstfile=2019062206_201906201857_2_stormforecast.xml;

      SYNOPSIS

      A southwesterly flow persists over a large part of western, central and northern Europe. A trough initially over Scotland moves to the northern Baltic Sea. Ahead of it, a surface cyclone should develop over North Sweden. A fairly humid and warm air-mass resides over Finland, the Baltic States into central Europe. Within this air-mass, scattered to widespread storms are expected to develop on Friday, as low to moderate CAPE develops.

      Upstream, a local vorticity maximum over the Bay of Biscay moves slowly eastward and reaches central France on Saturday morning. Isolated to scattered storms are expected to develop over Southeast France and Northeast Spain.

      DISCUSSION

      Finland, Russian Karelia...

      In response to solar heating and some upward motion due to a minor shortwave trough, widespread storm initiation is expected across Western and Central parts of Finland. 500 - 1500 J/kg MLCAPE are predicted to develop with about 15 m/s unidirectional shear. This suggests that well-organized multi cells and transient supercells are likely, which may produce some large (2-4 cm) hail, and locally damaging winds along with heavy rain. The storms should increasingly cluster and move east into Russian Karelia.

      Russian Leningrad, Vologda, Tver, Pskov, Novgorod oblasts, Southeast Estonia, Latvia, Lithuania, Belarus, West Ukraine, Poland, Czechia, Slovakia, Hungary, the northern Balkans, Austria...

      In the aforementioned humid air-mass, about 1000-2000 J/kg MLCAPE are expected to develop, as a diffuse cold front moves eastward across the Baltic States and Poland. 0-6 km bulk shear is expected to be around 10 m/s across the entire region. NWP guidance suggests that scattered to widespread convection will initiate across this large region with only marginal large-scale forcing for lift. The amount of instability and shear should support well-organized multi cells with a risk of 2-5 cm large hail and locally, severe wind gusts and very heavy rain.

      It is difficult to pinpoint any favoured regions for higher severe weather probabilities, as those will depend on mesoscale details with low predictability. That being said, across Northwest Ukraine and South-central Belarus the best CAPE and shear overlap is forecast, with around 2000 J/kg and 15 m/s of 0-6 km bulk shear. Here, the risk of hail, severe wind gusts appears high enough to warrant a level 2.

      NE Spain, SE France

      Ahead of the vorticity maximum moving east across southern France, large scale upward motion will aid the development of convection across these areas. Relatively strong bulk wind shear of 15-25 m/s in the 0-6 km layer suggests that a number of supercell storms may develop, e.g. over the Pyrenees, the mountains of NE Spain and possibly the southern Massif Central and the northern Apennines. With 1000-1500 J/kg of MLCAPE predicted, such storms will bear a risk of large (2-5 cm), and possibly even somewhat larger hail. A low-end risk of severe winds and heavy rain will also exist.

      North Italy, Slovenia, North Croatia

      During the day storms that develop in these areas will do so in an environment with about 10 m/s of deep-layer shear. However, as the mid-/upper-level system from France approaches, shear forcing for upward motion will increase. As a result, scattered to widespread, likely somewhat elevated storms are expected during the late evening and night, that may be well-organized. They may bring some large hail and possibly also severe wind gusts and very heavy rain.

      The Alps

      Diurnally-driven storms are expected to become quite widespread in a weakly capped environment. Some risk of marginally severe hail and locally heavy rainfall are forecast.

      Turkey

      Widespread storms are expected to initiate across the Turkish highland. Although some marginally severe hail or a very isolated severe wind gust cannot be discounted, the virtual absence of wind shear mitigates this risk to a large extent.

      Sweden

      Near the surface cyclone that forms across Northland, a number of slow-moving storms will develop, that could pose a risk of high rainfall accumulations. The risk is deemed a bit too low to warrant a level 1.

      posted in Articles article estofex forecast severe weather europe
      T
      TomSlavkovsky
    • WMO: A new heatwave hits Europe

      For the second time in less than one month, a widespread and intense heatwave impacted Europe, with many new maximum and minimum temperature records, disruption to transport and infrastructure and stress on people's health and the environment.

      Belgium, Germany, Luxembourg and the Netherlands saw new national temperature records, as temperatures passed the 40° Celsius mark at the peak of the heatwave on 25 July. In France, Paris recorded its hottest day on record, with a provisional temperature of 42.6 °C at 1632, an unprecedented value since the beginning of measurements. The United Kingdom saw its hottest July day on record.

      National meteorological and hydrological services have issued heat alerts - including the top-level red alert - and, in some areas, fire warnings to minimize the risk to life and the environment.

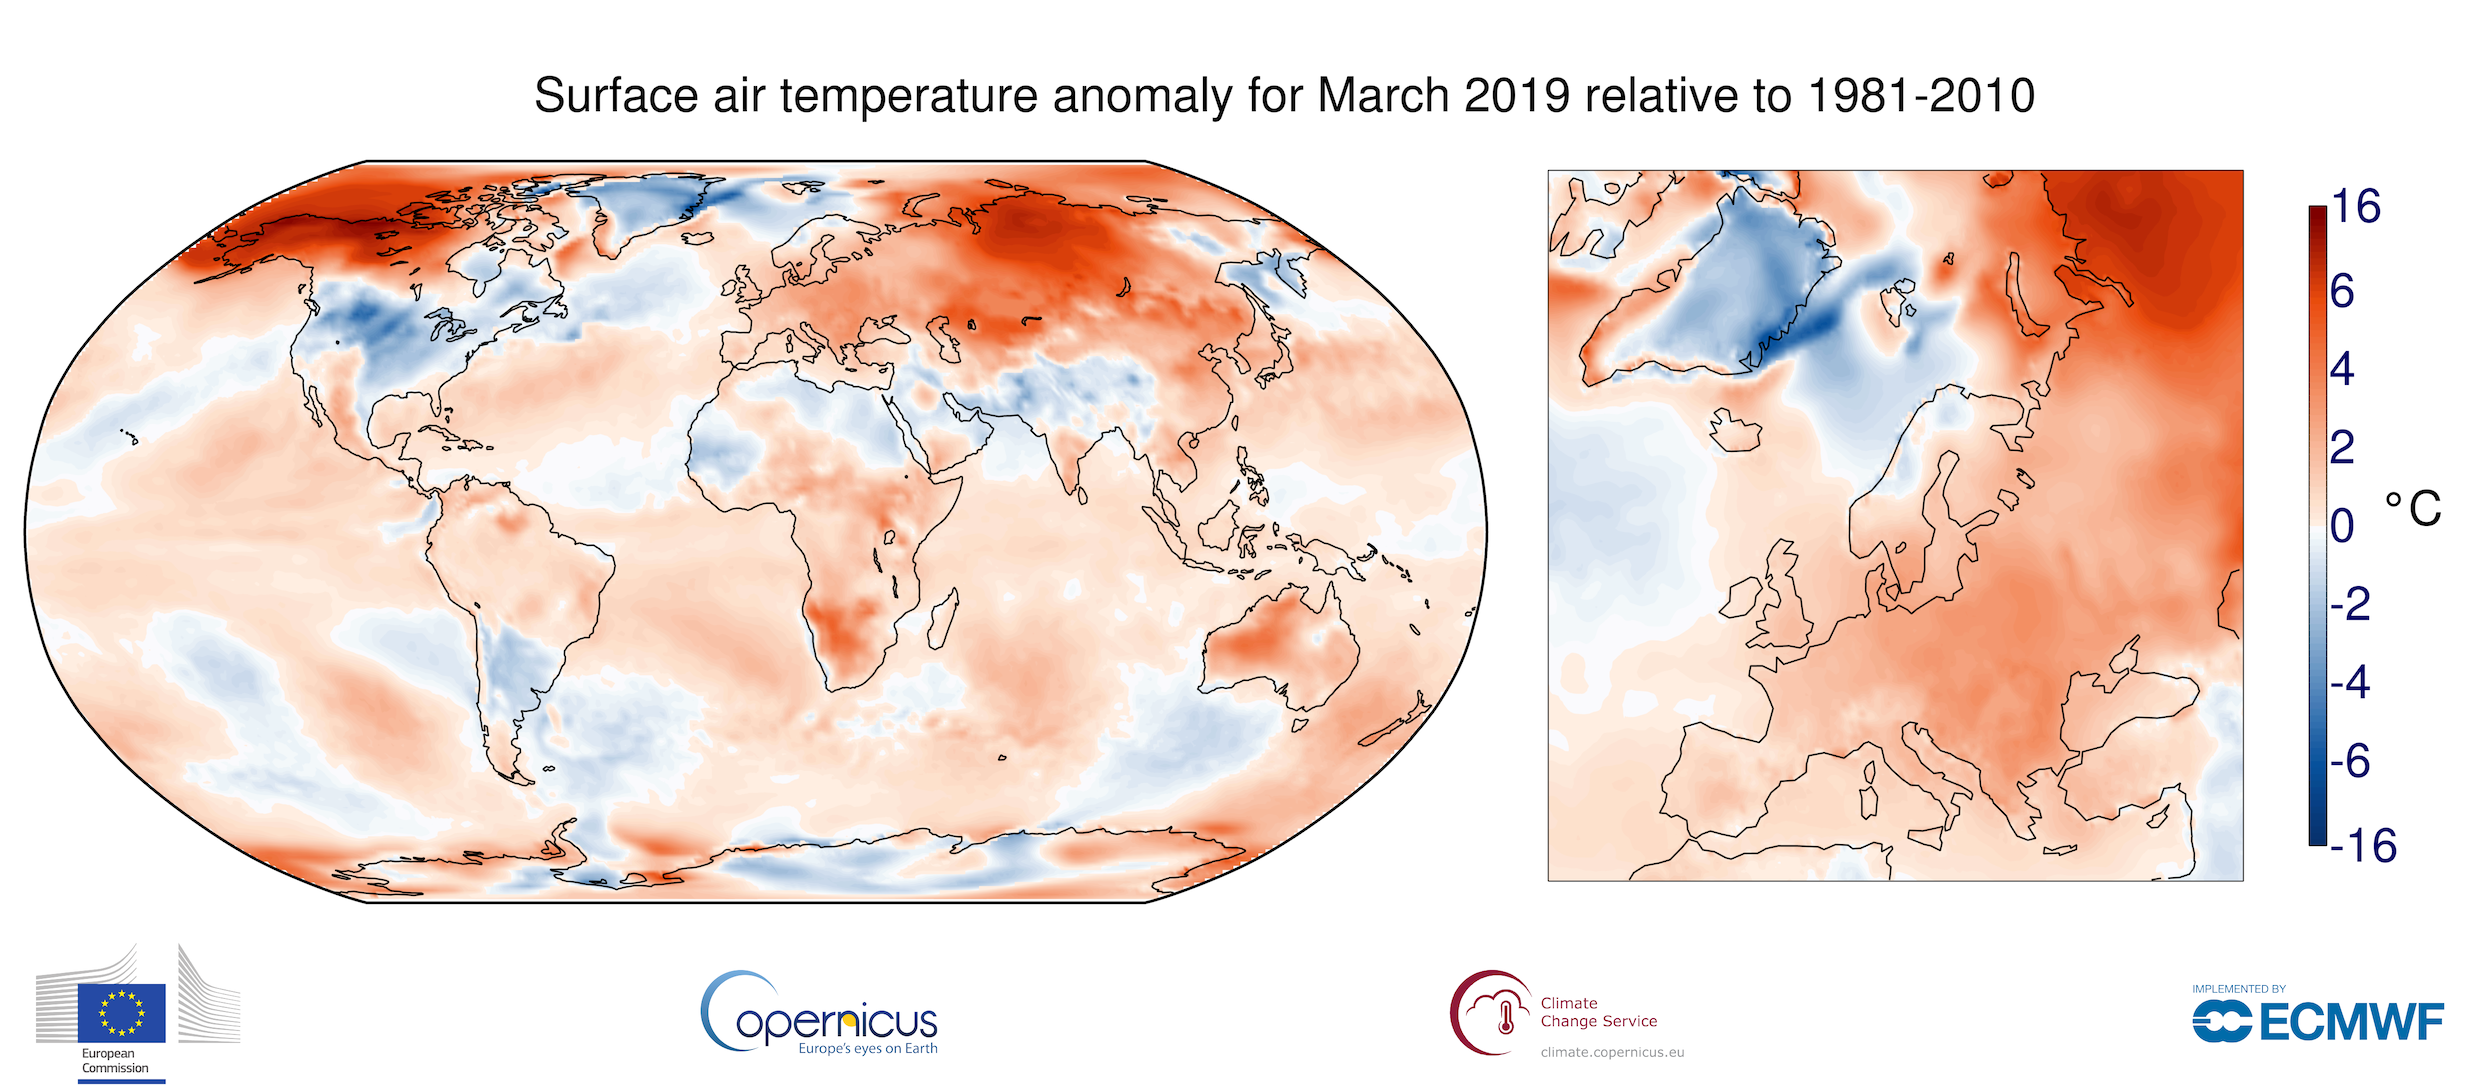
      The heatwave was caused by warm air coming up from North Africa and Spain. According to forecasts, the atmospheric flow will transport the heat towards Greenland, resulting in high temperatures and consequently enhanced melting. Persistent high melt and runoff the last few weeks but season total running just below 2012 record high loss, according to climate scientists with the Danish Meteorological Institute. This will also impact Arctic sea ice, which where the loss of ice extent through the first half of July matched loss rates observed in 2012, the year which had the lowest September sea ice extent in the satellite record, according to the US National Snow and Ice Data Center.

      The July heatwave follows an unusually early and exceptionally intense heatwave in June, which set new temperature records in Europe and ensured that the month of June was the hottest on record for the continent, with the average temperature of 2° Celsius above normal.

      June was also the warmest June on record globally, with severe wildfires in the Arctic.

      Climate change and heatwaves

      “Such intense and widespread heatwaves carry the signature of man-made climate change. This is consistent with the scientific finding showing evidence of more frequent, drawn out and intense heat events as greenhouse gas concentrations lead to a rise in global temperatures,” according to Johannes Cullmann, Director of WMO’s Climate and Water Department.

      “WMO expects that 2019 will be in the five top warmest years on record, and that 2015-2019 is to be the warmest of any equivalent five-year period on record,” he said. WMO will submit a five year report on the state of the climate 2015-2019 to the UN Climate Action Summit in September.

      Many scientific studies have been conducted on the links between climate change and heatwaves.

      "Every heatwave occurring in Europe today is made more likely and more intense by human-induced climate change," said a study published by scientists at World Weather Attribution on the Human contribution to record-breaking June 2019 heatwave in France.

      "The observations show a very large increase in the temperature of these heatwaves. Currently such an event is estimated to occur with a return period of 30 years, but similarly frequent heatwaves would have likely been about 4 ºC cooler a century ago. In other words, a heatwave that intense is occurring at least 10 times more frequently today than a century ago," it said.

      In its Fifth Assessment Report (2014), the Intergovernmental Panel on Climate Change said that “it is very likely that human influence has contributed to the observed global scale changes in the frequency and intensity of daily temperature extremes since the mid-20th century. It is likely that human influence has more than doubled the probability of occurrence of heat waves in some locations.”

      In its 2018 report on Global Warming of 1.5°C, the IPCC said that climate-related risks to health, livelihoods, food security, water supply, human security, and economic growth are projected to increase with global warming of 1.5 °C and increase further with 2 °C.

      Limiting warming to 1.5 °C rather than 2 °C could result in 420 million fewer people being exposed to severe heatwaves, it said.

      Between 2000 and 2016, the number of people exposed to heatwaves was estimated to have increased by around 125 million persons, as the average length of individual heatwaves was 0.37 days longer, compared to the period between 1986 and 2008, according to the World Health Organization.

      Many countries have issued national climate assessments and scenarios which underline the close connection between climate change and heat.

      For instance, the UK State of the Climate report showed an increase in higher maximum temperatures and longer warm spells. The hottest day of the year for the most recent decade (2008-2017) has increased by 0.8°C above the 1961-1990 average. Warm spells have also more than doubled in length – increasing from 5.3 days in 1961-90 to over 13 days in the most recent decade (2008-2017).

      
photo:Met Office;
desc:UK Heatwaves.;

      The summer of 2018 was the joint warmest on record for the UK as a whole and the hottest ever for England. The Met Office research showed that human-induced climate change made the 2018 record-breaking UK summer temperatures about 30 times more likely than it would have been naturally. By 2050 these are expected to happen every other year.

      France has also reported an increase in the frequency and intensity of heatwaves over the past 30 years, according to Météo-France, in an observation echoed elsewhere in Europe.

      Swiss climate change scenarios warn that if greenhouse gas emissions continue to increase, by the middle of this century, average summer temperatures may be up to 4.5 °C higher than now.

      “The increases in the highest temperatures are even more pronounced than for the average seasonal temperatures. By 2060, the hottest days in an average summer could be up to 5.5 °C higher than they are today. This is explained in part by the fact that less water will be evaporating and cooling the ground because there will be less moisture in the soil,” says the Swiss report.

      “The regions of Europe that surround the Mediterranean Sea, including Switzerland, are affected by some of the most severe increases in temperature extremes worldwide. This trend has been apparent even over recent decades and is very likely to continue into the future,” it says.

      Current heatwave

      The new absolute record of 42.6°C for Paris was recorded on 25 July at the centennial weather station in Paris-Monsouris, and broke the previous record dating back to 28 July 1947 with 40.4 °C. This temperature is typical of the average July temperature in Bagdad, Iraq. The night of 24/25 July was also exceptionally hot, with minimal temperatures above 25°C and even 28.3°C in a downtown Paris weather station. What is striking is the margin with which the records were beaten. Lille recorded 41.4°C, that’s nearly 4°C above the previous record. France set a new national temperature record of 46°C during the last heatwave on 28 June.

      It was only the second time Méteo France has ever issued red level warnings for a heatwave in France. The first time was during June's heatwave when several departments in the south were put on red alert. But it is unprecedented for Paris and the north of the country to be on a red alert for a heatwave.

      Météo France said, "all of us are threatened, even healthy people." It adds: "The danger is greater for seniors, people with chronic illness or mental health issues, people who take regular medication and people who are isolated." Those who work outside are told to take care and watch out for the signs of heatstroke.

      The German Weather Service, Deutscher Wetterdienst, described 25 July as A day which will make weather history. Germany set a new national temperature record (provisional figure) of 42.6°C in Lingen, near the Dutch border, defeating the old record by 2.3 °C. There were 25 weather stations above 40 °C. The previous national temperature record was 40.3°C (5 July 2015).

      The Netherlands broke a 75-year-old heat record (set in Aug 1944) with a temperature of 40.7°C at Gilye Rijen. Belgium also set a new national record of 41.8°C. Luxembourg set a new national record of 40.8°C.

      Temperatures in the United Kingdom reached 38.1 Celsius in southern England, setting a new record for the highest July temperature recorded in the UK. The new record was set in Cambridge at 15:37 this afternoon, beating the previous record of 36.7°C set in Heathrow in 2015, according to the Met Office.

      Météo-France is warning that the heatwave will accentuate the drought because it has not rained in many parts of the country since the end of the last heatwave at the start of July. A number of places have set new records for the lowest amount of rainfall since records started, including 0.2 mm at Orly airport, 1 mm in Lille. Thousands of hectares were burned by wildfires in northern France, where it is very unusual to see wildfires. In Normandie alone, a total 1500 hectares burnt yesterday with 28 different fires. This region never experienced such a situation before.

      Spain’s national meteorological service, AEMET, is also forecasting temperatures of above 40°C and AEMET is warning of extreme fire risk in large parts of the country because of a combination of heat, wind and lightning. A fire raged in central Portugal at the start of the week.

      National meteorological and hydrological services in Europe work closely with national and local authorities on heat-health action plans to protect lives. These heat-health early warning systems have activated civil protection efforts across the region.

      Heat events kill thousands of people every year and often trigger secondary events such as wildfires and failures to electrical grids.

      Urbanization compounds the problem. Heatstroke, dehydration, cardiovascular and other temperature-related diseases are major health risks.

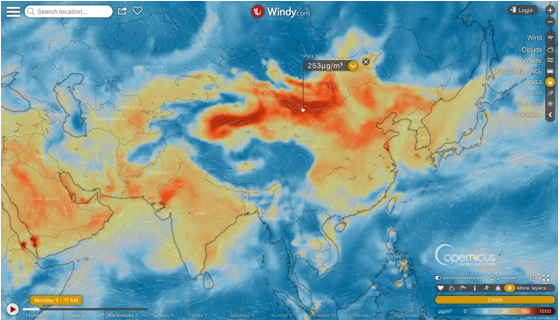
      During the ongoing heatwave, public transport was disrupted and authorities in many cities imposed limits on private cars to try to keep pollution in check.

      posted in Articles article wmo heatwave climate change environment
      T
      TomSlavkovsky
    • Cyclone Fani in Pictures as making Landfall on India's Coast

      Tropical cyclone Fani makes landfall with Category 4 hurricane-equivalent strength. Here are videos catching the impact of Fani.

      https://www.windy.com/annotation/5ccc27ac994260001bc372e6

      posted in Articles article cyclone fani
      T
      TomSlavkovsky